Using icons or pictures as filters or to navigate in Tableau can be a really easy way of making dashboards more visual and easy to use. And it’s very simple to do.
Step 1: Select the Field to use as a Filter
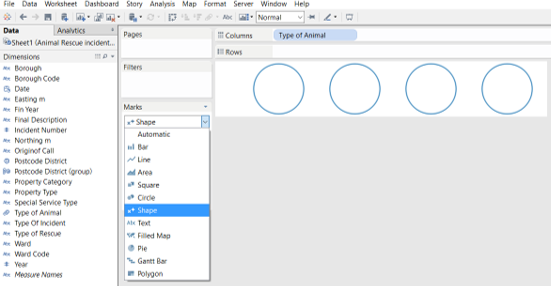
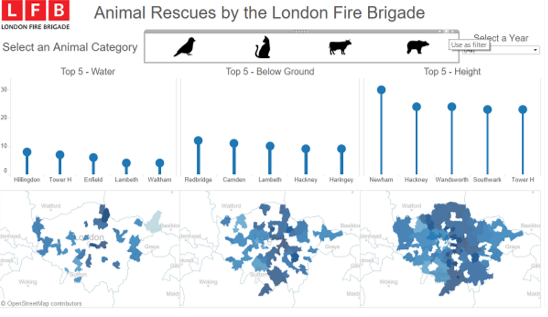
In my example I was using a dataset on Animal Rescues by the London Fire Brigade. Within my data there was a field with types of animals, so I decided to use this field to filter the rest of my dashboard, and I wanted to do this using images rather than using a dropdown filter.
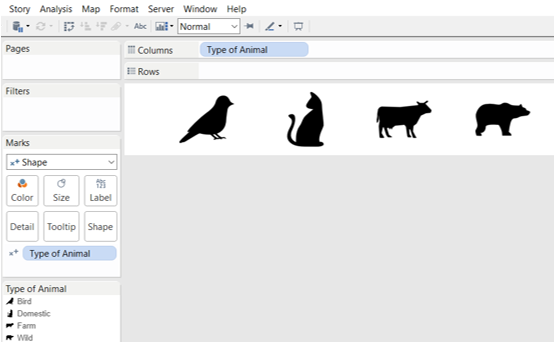
In a blank worksheet I dragged my ‘Type of Animal’ field from my Dimensions onto the Columns shelf. Then, in the Marks dropdown menu I changed the marks from Automatic to Shape. This automatically displayed my data as four circles (there were four categories within my Type of Animal field).
Step 2: Drop the Field to the Shape Shelf
To ensure Tableau recognises each different animal category as a different shape, the Types of Animal field needs to also be put onto Shape which should have appeared within the Marks shelf.
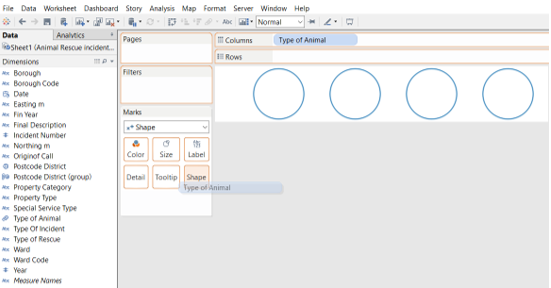
Once this has been done, Tableau will assign each category a shape from its default shape palette.
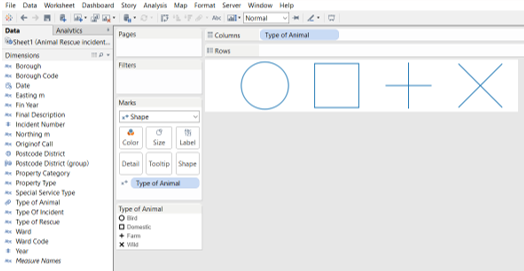
Step 3: Find your Custom Shapes
The next step is to find a shape for each of your categories and save them to your Tableau Repository. There are lots of good sites which have basic shapes and icons, such as:
Once you have found a shape you want to use, download it and save it in ‘Shapes’ within your ‘My Tableau Repository’ folder. To make sure your shape has a transparent background, download and save it as a .PNG. I usually create a specific folder within my ‘Shapes’ folder to save custom shapes for a particular dashboard so I know where to look for them when I’m in Tableau.
Step 4: Edit your Shape in Tableau
Once you have saved all your custom shapes, go back to your Tableau worksheet and click on the dropdown menu of your shape legend and select ‘Edit Shape’. A menu will appear showing you your categories and the shape assigned to each. Click on one of the categories and click the dropdown menu under Select Shape Palette. You should see your new folder with your custom shapes now in the dropdown selection. If you can’t, sometimes you need to click on ‘Reload Shapes’ for the new shapes to be displayed.
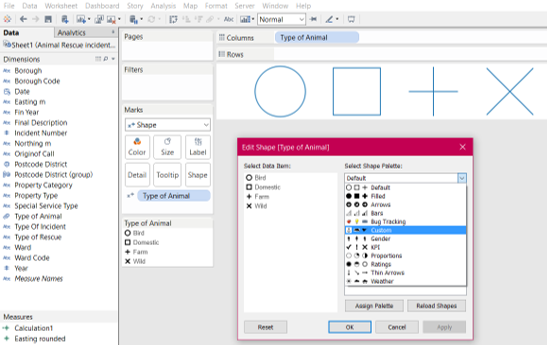
Click OK and you should now be able to assign any of your custom shapes to your categories.
Step 5: Add Your Shape Worksheet to your Dashboard
Once you have your dashboard set up, you can add the shape worksheet to it, and select to use it as a filter by clicking on the ‘Use as Filter’ symbol in the top right corner of the sheet container. Then when you click on a shape (Type of Animal) the other charts on the dashboard are filtered to just show that category. Click here for a link to my dashboard if you want to see how it works.
Tips:
- If you find that your icons are too big / small click on Size in the Marks shelf and adjust the size
- Drop ‘Type of Animal’ onto Colour in the Marks shelf if you want to distinguish your categories by different colours
- Click on Tooltips in the Marks shelf, and in the Edit Tooltips box you can click on ‘Insert’ and select ‘Type of Animal’ so that when you hover over each shape the category name will appear
- If you use icons from a website make sure you credit the author