Week 3 at Data School we were thrown head first into the world of Alteryx. It was probably the toughest week so far for me, just trying to get my head around: 1. The vast extent of what Alteryx can do, and 2. Understanding how to just create the simplest workflow.
Even after all the in-depth training we had throughout the week and finishing (to some extent) my workflow & macro, I still didn’t feel like I’d really understood what I was doing with Alteryx. So I decided to find a data set and create a very simple workflow to try and practise.
I thought I would see if I could somehow get the data from the sleep app I use on my phone and use that…turns out that was extremely easy, and took about 4 taps on my phone to download the csv file.
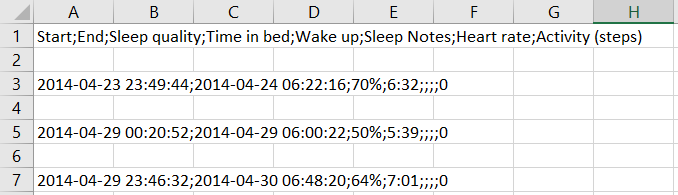
I used Alteryx to clean up the data and make it more Tableau-friendly, so that my data went from looking like this…
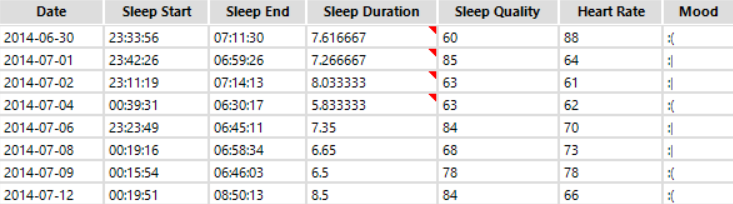
…to looking like this…
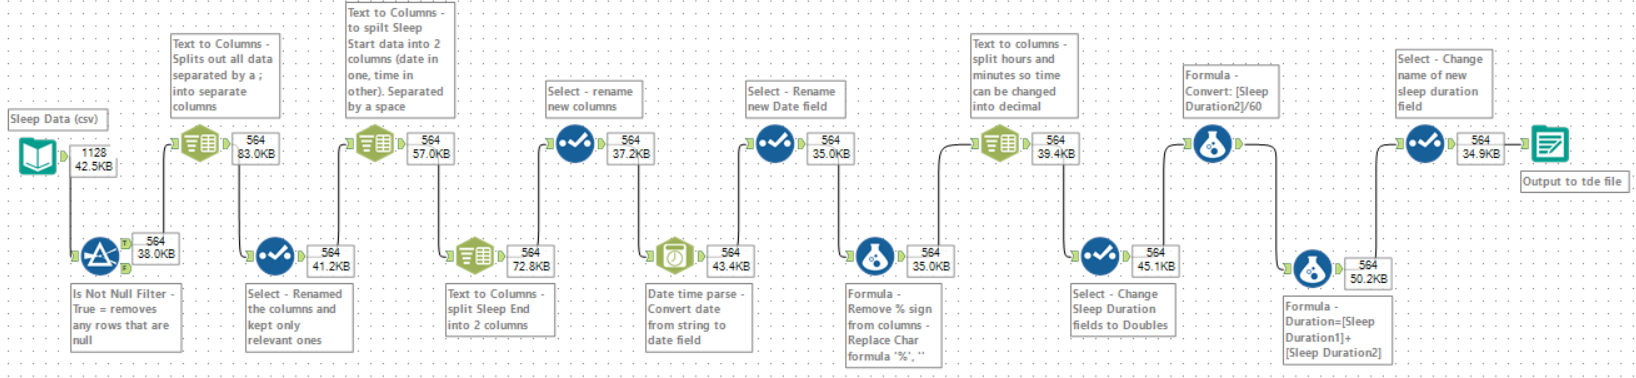
…using this workflow:
Step 1 – Filter
The first thing I saw in my csv file was that every other row was blank, and when I inputted my data into Alteryx, the blank rows were being displayed as nulls, so I wanted to remove these. To delete the blank rows I used the Filter tool and selected ‘Is not null’ to separate all the rows that had data in from those that did not. Everything returned as ‘True’ was my data, and everything returned as ‘False’ were the blank rows.
Step 2 – Text to Columns
As all my data fields were contained all in one row, the next thing to do was to split each individual field into an individual column. To do this I connected the Text to Columns tool to the True anchor from the filter tool then in the configuration pane I selected the field to split form the drop down (there was only one field) and changed the delimiter to a semi-colon as this was what was separating each data field in my csv. There were 8 different data fields within each row so in Alteryx I selected to split the rows into 8 columns.
Step 3 – Select
At this point, I now the correct columns, but the headings were all still grouped together, so I used the select tool to rename my column headings.
Step 4 – Text to Columns
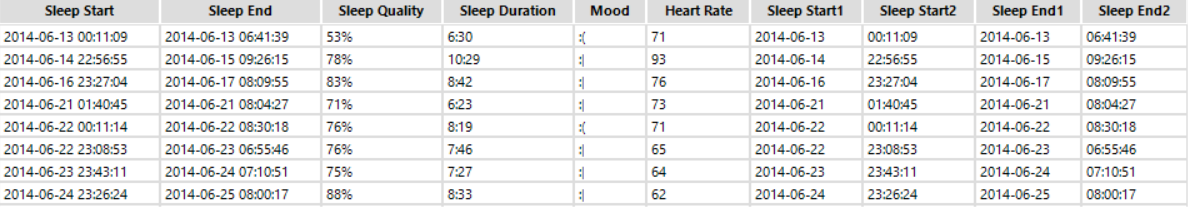
After step 2 there were still 2 columns which needed to be split out further – I had two columns with times in (sleep start time and sleep end time) and they both also had the date in. The time and date in each were separated by a space so when I did the first Text to Columns they did not split as I had set the delimiter to a semi-colon. So to split these out, I selected the first field (column) I wanted to separate, set the delimiter to a space and the number of columns to 2. Once I ran the workflow this returned the date in one column and the time in another. I then repeated this step for the second time / date field.
Step 5 – Select
Once again, after splitting out the fields I renamed the new fields using the Select tool, and deselected the old fields that I no longer needed.
Step 6 – Date Time Parse
My next step was to ensure that each of the data fields were in the correct formats. My date field was being read as a string so I needed to convert it to a date field. To do this I used the Date Time parse tool; I selected the date field I wanted to convert and selected the format I wanted it displayed in and again ran the workflow. This then gave me a new field called ‘DateTime_Out’. I then used a Select tool to deselect the old date field and rename the new DateTime_Out field to ‘Date’.
Step 7 – Formula
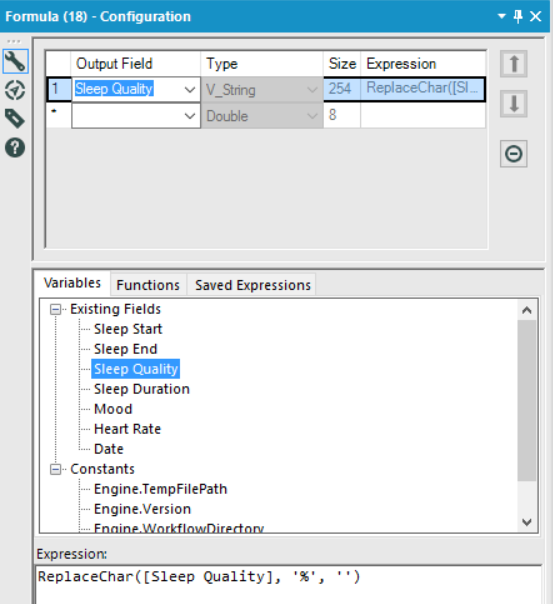
One of my data fields, ‘Sleep Quality’ is recorded as a percentage, but the % sign was included with the value, which I did not need / want. Therefore, I used the Formula tool to remove the % sign and just retain the value. I used the Replace Character formula to replace the % with nothing, i.e. remove the % sign. The formula I used was: ReplaceChar([Sleep Quality], ‘%’, ”) This formula told Alteryx to look at the data field ‘Sleep Quality’ and replace whatever was within the first set of ‘ ‘ (in this case the % sign) with whatever was within the second set of ‘ ‘ (in this case nothing).
Step 8 – Text to Columns
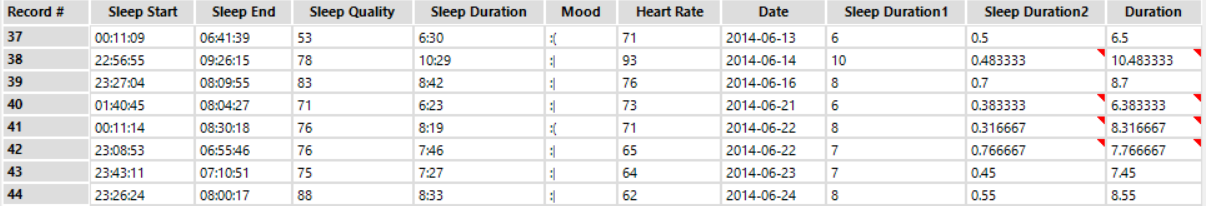
I noticed that the values in the ‘Sleep Duration’ column were measured as time, which is fine to see when I look at my app, but if I wanted to use this field for calculating average or total sleep duration in Tableau, I wanted to change this to a decimal number so it would be easier to work with. However, as the data was currently measured as hours and minutes, I only wanted to change the minutes to decimals, so first I had to split out the minutes from the hours using the Text to Columns tool.
Step 9 – Select
Once I had my two new fields, one containing hours and one containing minutes, I would be able to change the minutes to a decimal number and then join the two columns back together. To do this involved a couple of steps, first of which was to use the Select tool to change the values in the two new fields from Strings to Doubles.
Step 10 – Formula
Next I needed to convert my minutes into a decimal number. To do this I needed to simply divide the minutes by 60 to return the decimal. I used the Formula tool, selected the new column with just the minutes ‘Sleep Duration2’ and used this formula: [Sleep Duration2]/60
Step 11 – Formula
Now that I had the correct format for my Sleep Duration columns, I needed to join two back together. I used another Formula tool to simply add the columns together: [Sleep Duration1]+[Sleep Duration2]. I was then able to use the Select tool to rename the new field and deselect the original field that I no longer needed.
Step 12 – Output to tde
Once I ran the data, checked all my fields were in the correct format, had the correct headings, I used to Output data tool to write my data to a tde file so that it was ready to start creating a viz in Tableau.