With a quick table calculation, we can in Tableau compute percentiles for a set of values.
When to use Percentile Calculation?
When we are interested in comparing how an employee or company stands when compared to the rest of companies/ employees in the field; to be able to compare performance, we need a statistical method that reports relative standing – the percentile.
How to we use it in Tableau?
By using percentile as a ranking ‘measure’. In other words as per the following example:
- One student is looking at four-year review scores for a group of universities, so he can decide where to apply:
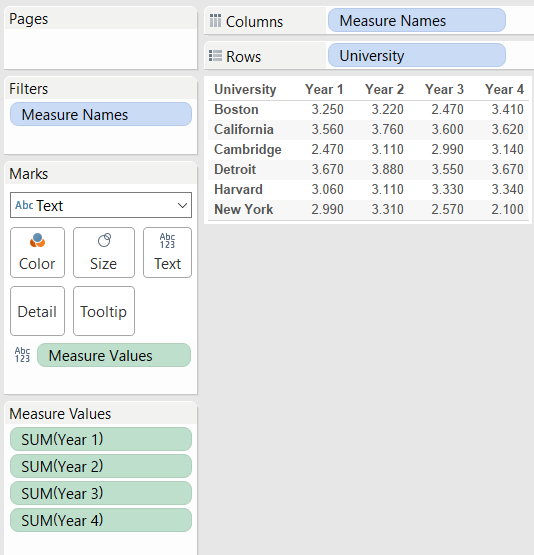
The student wonders how the universities rating has changed over time, relative to each other. To find out, the student applies a Percentile table calculation to the reviews for each year, to obtain the following result:
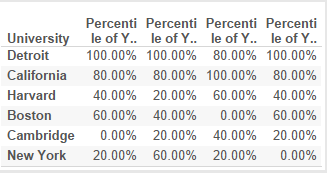
The student can now observe that despite some fluctuations, the universities rating was relatively stable relative to each other during the four years.
To obtain this view, the student had to apply a Percentile table calculation to each of four measures: Year 1, Year 2, Year 3, Year 4. For each of these measures the student used tableau by:
- Clicking the year in the view and selecting Add Table Calculation.
- In the Table Calculation dialog box, selectedPercentile from the Calculation Type drop-down.
- SelectedTable (Down) from the Running along
- And chose Ascending as sorting direction.
What is then a percentile? And how do we calculate it mathematically?
The kth percentile is a value in a data set that splits the data into two pieces: The lower section contains k percent of the data, and the upper piece contains the rest of the data (which totals to [100 – k] percent, because the total amount of data is 100%), where k is a number between 0 and 100.
Bearing in mind that the median is the 50th percentile, the ‘transition’ point where 50% of the data falls below that point, and the remaining 50% falls above it.
If we were to calculate the kth percentile (where k is any number between zero and 100), we had to:
- Order all the values in the data set from smallest to largest.
- Calculate an index by multiplyingk percent by the total number of values, n.
- If the index obtained above:
- is not a whole number, we should round it up to the nearest whole number and count the values in the data set from smallest to largest value, until we reach to the number occupying the position indicated by the index;
- is a whole number, we should count the values in the data set from left to right until we reach the number occupying the position indicated by the index;
The kth percentile is then the average of that value and the value that directly follows it.
Putting the theory into practice – Let’s suppose we have 25 test scores ordered from the lowest to the highest, such as:
43, 54, 56, 61, 62, 66, 68, 69, 69, 70, 71, 72, 77, 78, 79, 85, 87, 88, 89, 93, 95, 96, 98, 99, 99
To find the 90th percentile for these (ordered) scores, we had to multiply 90% (0.9) times the total number of scores, which gives 90% ∗ 25 = 0.90 ∗ 25 = 22.5 (index calculation). Rounding it up to the nearest whole number, we then get 23.
If we now count from left to right (from the smallest to the largest value in the data set), until we find the 23rd value in the data set, that value corresponds to 98, corresponding to the 90th percentile for this data set.
Let’s say we want to find the 20th percentile:
- Find the index, by multiplying 0.20 x 25 = 5 – this is a whole number, so the 20th percentile is the average of the 5th and 6th values in the ordered data set (62 and 66). The 20th percentile then comes to (62 + 66) ÷ 2 = 64.
For this data set the median or the 50th percentile for the test scores is the 13th score, corresponding to 77.
There are various ways of calculating percentiles, the one explained is just one of many ways. The multitude of ways to calculate percentiles may lead to approximate values and not exact values when comparing the results, don’t be alarmed is just the way of computing the percentiles.