When using Tableau to build a visualisation, you may have noticed that dimension headers normally belong at the top of a chart, and a measure axis at the bottom. However, in some occasions we may wish to revert this and here is where this blog post may come in handy.
Moving table headers to the bottom:
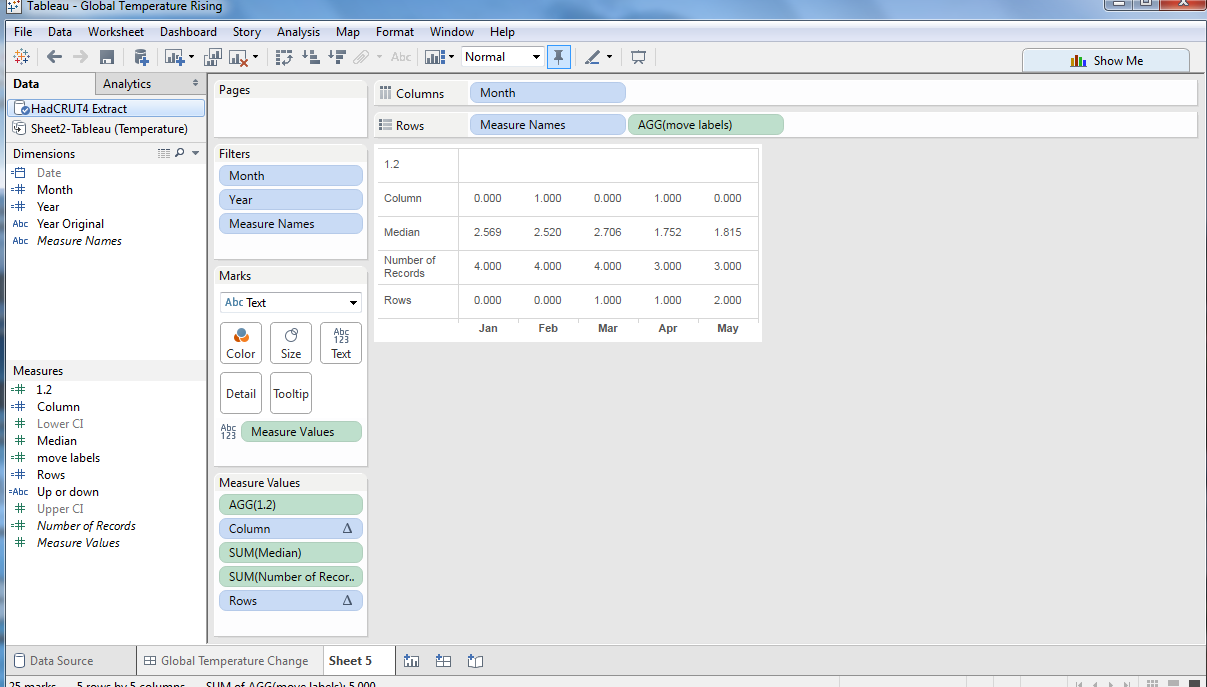
- Build your table as normal.

2.Create a calculated field with the formula:
![]() – and drag it onto rows. The presence of a vertical axis forces the dimension headers to the bottom of the view.
– and drag it onto rows. The presence of a vertical axis forces the dimension headers to the bottom of the view.
- Fix the axis to 0-2 and hide the axis header. Dragging borders around, gives us a good looking table with footers.
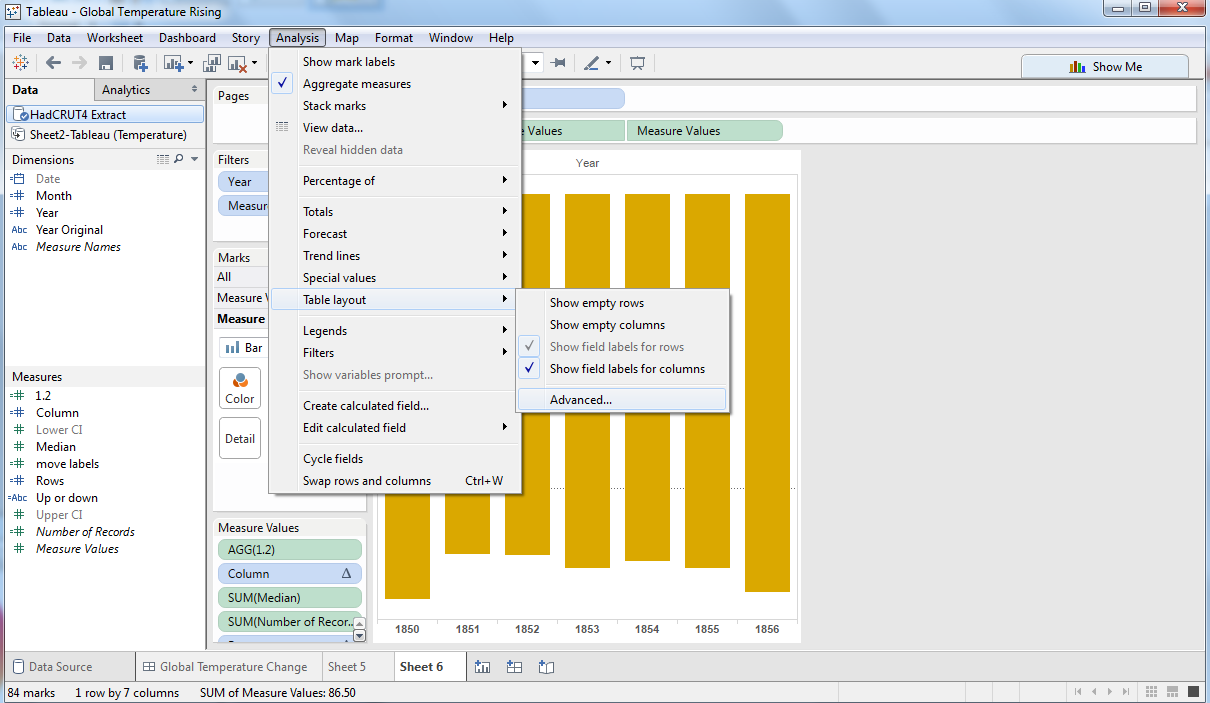
Measure axis to the top:
- Go to Analysis
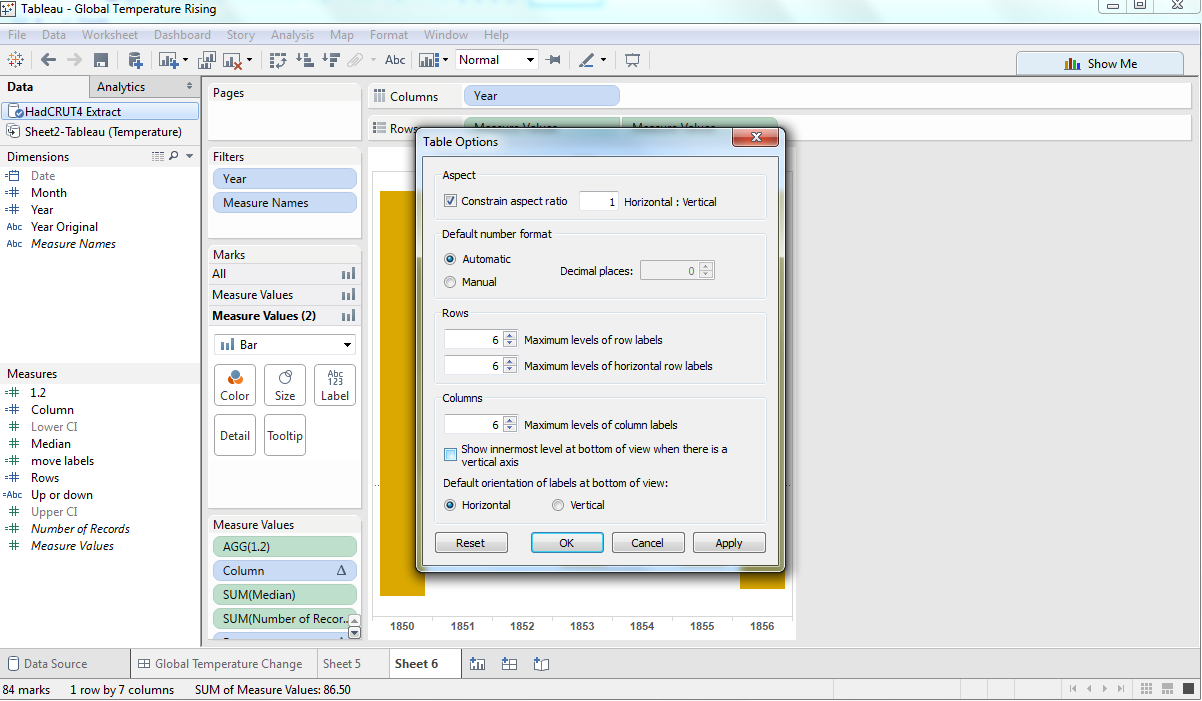
- Select Table Layout > Advanced – and then deselect the “Show the innermost level at bottom of view when there is a vertical axis”.
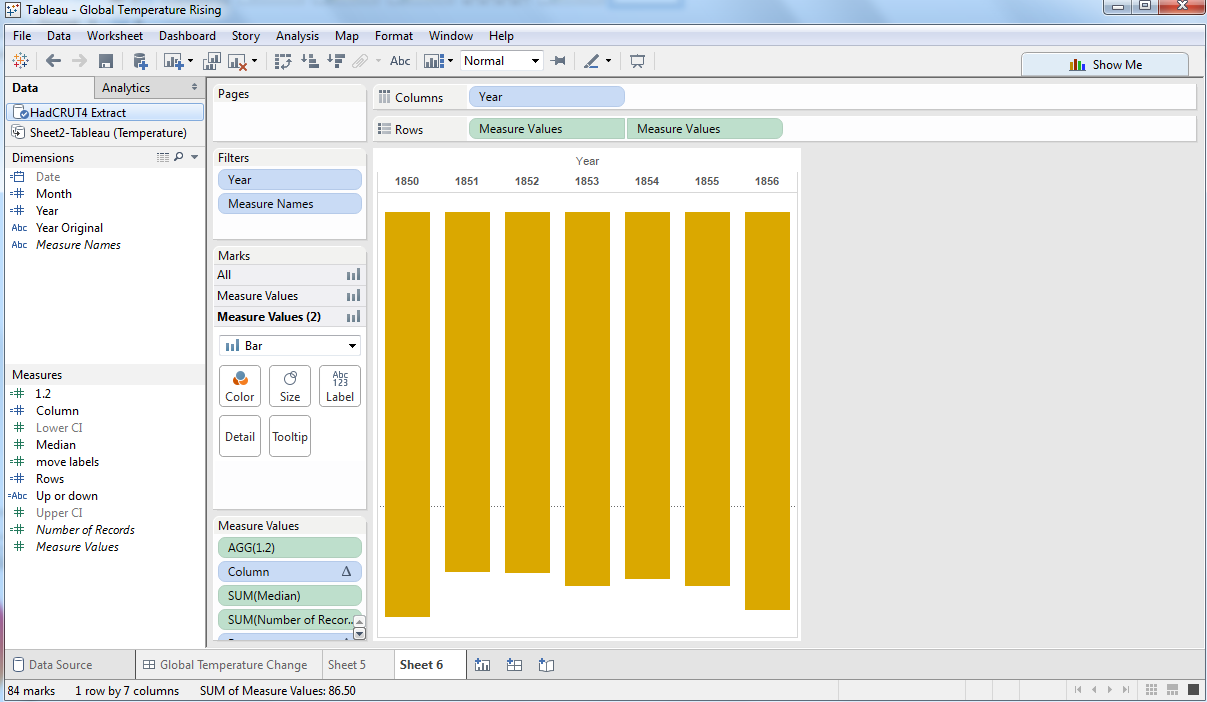
Voilà!
Two simple tricks that may help you format your visualisations.