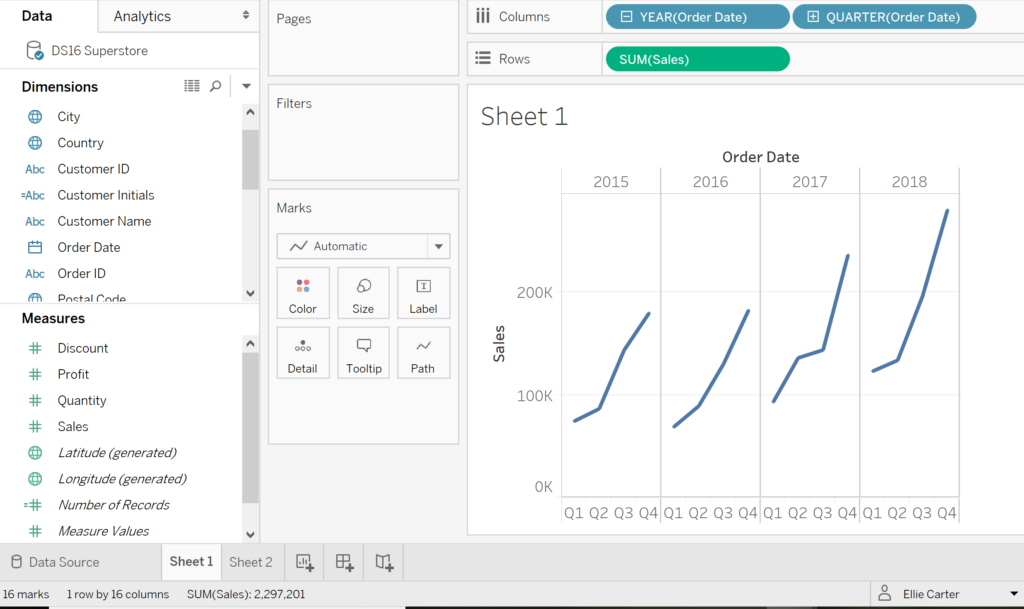
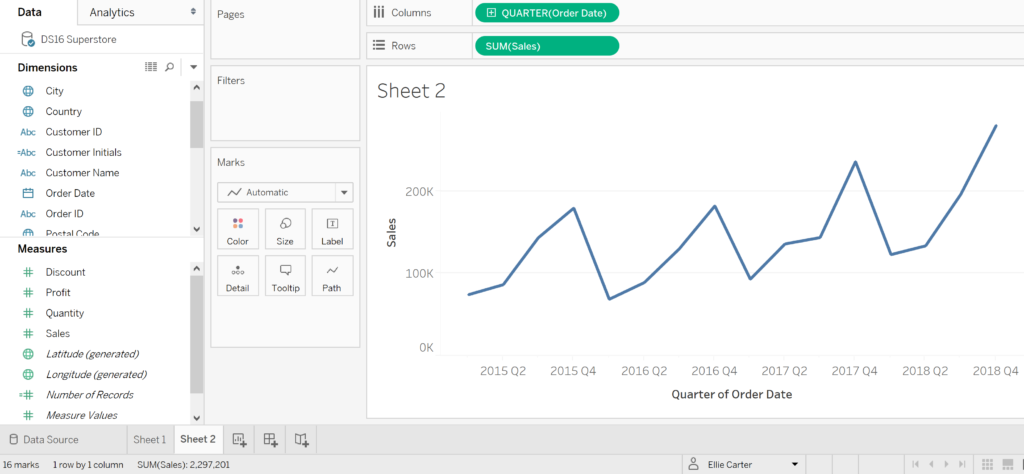
During our first couple of days as DS-ers we have been covering Tableau Fundamentals. For my first actual Tableau based blog post I am keeping it super simple with continuous vs discrete dates. The data I have given as an example shows sum of sales by quarter for each year.
Discrete
- There are two date fields in columns required to narrow down the sales by quarter per year- both are in blue meaning it is discrete
- Discrete data generates rows and columns (see bottom left corner, 1 row and 16 columns)
- The years are separated by a columns
Continuous
- There is only one date field required columns to show each quarter per year- this time it is green indicating that it is continuous
- Continuous measures create axes (see bottom left corner, 1 row and 1 column)
- The years are not split by columns, instead there is one continuous line joining each year to the next
A very simple overview into discrete vs continuous data!