


At the Data School, Carl Allchin (Head Coach) is always on the lookout for new and creative Preppin’ Data challenges. Given our shared passion for American sports, I thought it would be exciting to create a challenge in that vein.
One of the most common debates in sports revolves around determining the "best" team or athlete. However, this is no simple task—comparing performance across different sports is inherently tricky due to variations in scoring, rankings, and game formats. To tackle this, I decided to create a unified league table that brings together teams from several major sports, standardizing their performance metrics for direct comparison.
Key Considerations
1. Scoring Differences Across Sports
Not all leagues rank teams the same way. For instance, the NFL ranks teams based solely on wins, while the English Premier League (EPL) awards points (3 for a win, 1 for a draw). Additionally, some sports incorporate unique bonuses—like Rugby’s extra points for tries scored, even in losses.
To ensure fairness, I built this table around the core Ranking Field each sport uses, reflecting what teams are ultimately playing for.
2. Tie-Breaking Rules
Sports leagues often rely on tie-breaking criteria to separate teams with equal rankings. For example, in the EPL, ties are broken by goal difference, while the NBA considers divisional wins. After analyzing various leagues, I decided on the following tie-breaker rules:
- Premier League: Tie Breaker 1 = Wins; Tie Breaker 2 = Goals For
- NFL: Tie Breaker 1 = Points Differential; Tie Breaker 2 = Points For
- NBA: Tie Breaker 1 = Games Behind; Tie Breaker 2 = Conference Wins
- Rugby: Tie Breaker 1 = Wins; Tie Breaker 2 = Points Differential
3. Normalizing for Number of Games Played
Not all sports seasons involve the same number of games. For example, NBA teams play 82 games, while the NFL season is only 17 games long. To account for this disparity, I needed a method that normalized rankings across sports.
Acquiring and Processing the Data
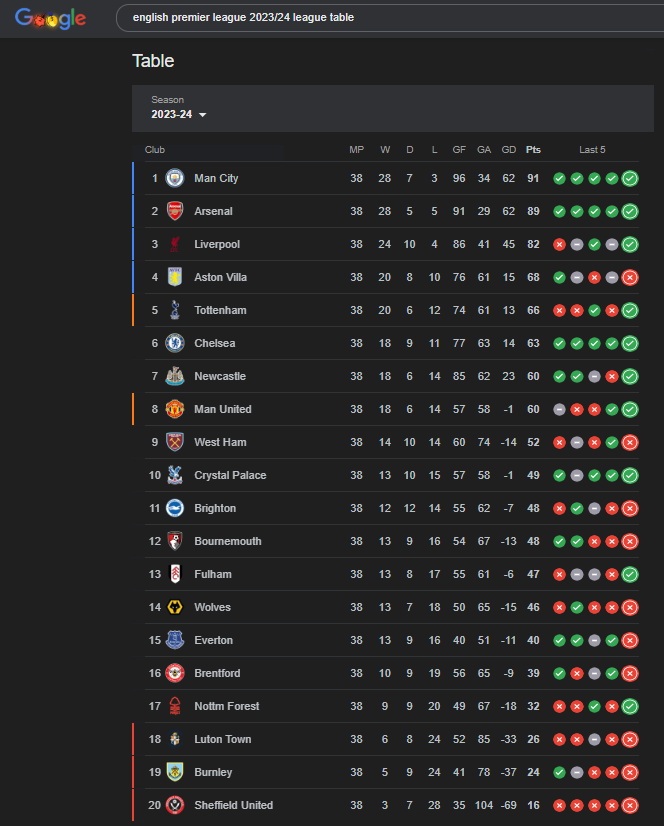
To build the table, I started by gathering data from readily available sources. A simple Google search (e.g. “<Sport> 2023/24 league table”) provided up-to-date league standings for the current season.
Building the League Table
To standardize performance metrics, I calculated a z-score for each team within its respective sport. A z-score measures how far a value is from the mean, in terms of standard deviations. This allowed me to normalize rankings across sports with different scoring systems. The formula for a z-score is:

Where:
- z=z-score
- 𝒳=Ranking Field
- μ=Mean
- σ=standard Deviation
Teams with equal z-scores required additional tie-breaking. In these cases, I used the percentile rank of the team within its sport to determine their final position.
Additional Insights
Beyond ranking individual teams, I also analysed which sport, on average, produced the highest z-scores. This enabled me to create a sport ranking based on their overall competitiveness.
Outputs
The final outputs included:
- Unified League Table: Featuring six fields and 93 rows, ranking all teams from the selected sports.

- Sport Ranking Table: A summary with three fields and five rows, ranking sports based on their average z-scores.
