At the latest Tableau conference in London I attempted to take Tableau’s qualification exam. A bit of an ambitious idea as I had been using Tableau for two weeks only, and in fact I didn’t pass. So now that I have some more experience under the belt I am preparing to take the exam again and here are a few subtleties which I have learned about Tableau and that I wish I knew before taking the exam.
1. When sorting, Tableau does not change your leftmost header
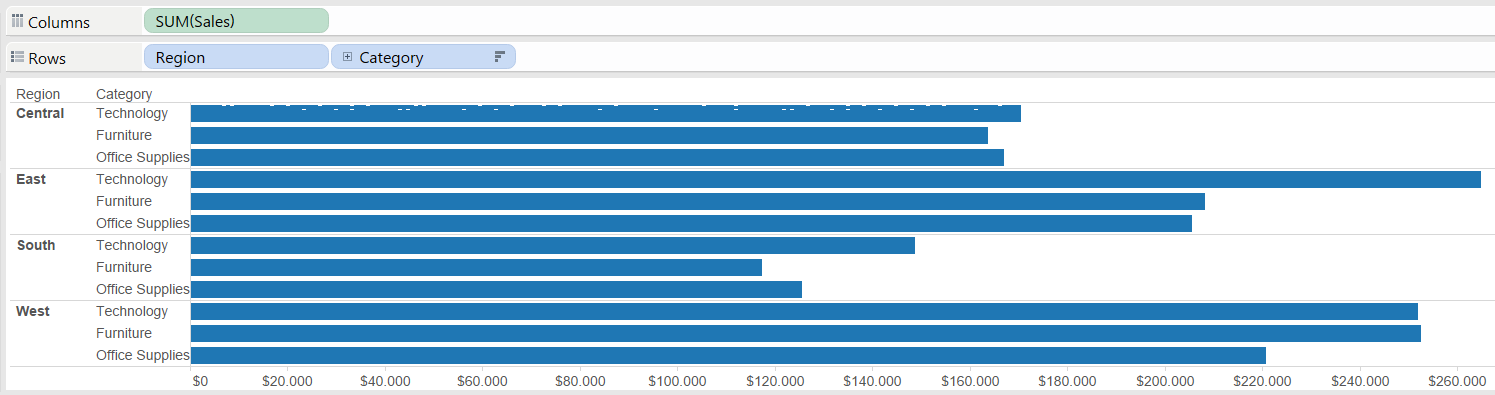
Below is a picture of everyone’s favourite dataset. Notice that I have sorted Category by Sales in descendent order but the sorting is done only within the Category pane, the order within the Region dimension has not changed.
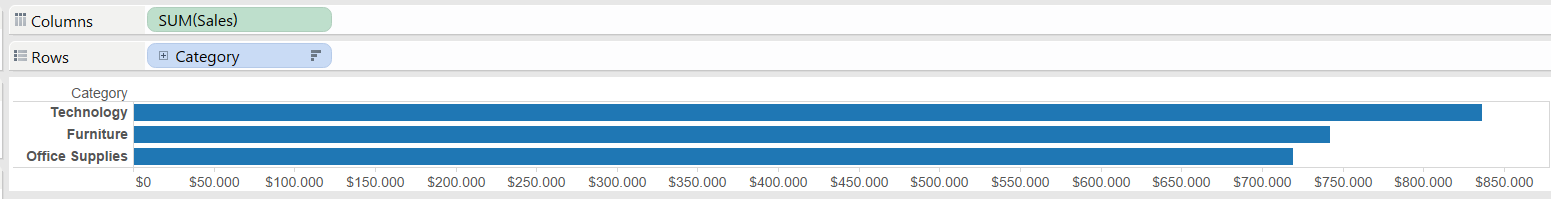
One way to overcome this is simply to drag out your leftmost field and Tableau will rearrange the bars accordingly to show which categories have the highest sales.
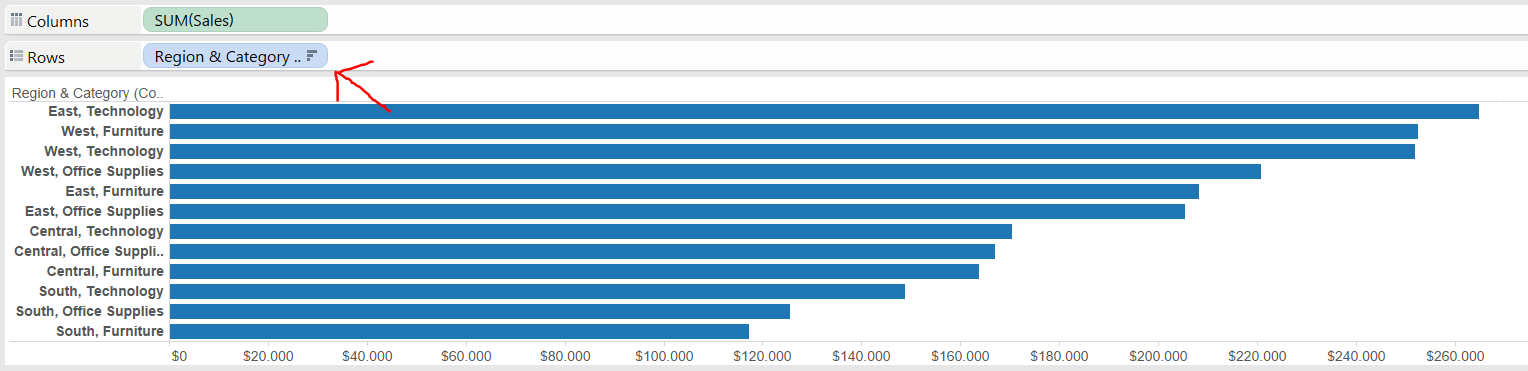
The drawback of this method is that you have now lost the information about your region. This can be remedied by selecting and right clicking on the two dimensions that make up your view and create a combined field which you can now use to sort your marks.
2. Tableau applies filters in a precise order
This is important to know as your results might change according to which filter you use and when you use it. Here is the list with a brief explanation for each type of filter:
- Extract filter. This filter is applied when you create an extract with your data, for example from a live source. Tableau will hide unused fields and aggregate measures to the level you are using in your visualisation
- Data source filter. From the data source in Tableau click on Filters – Add in the top right of the screen and you can add fields to filter out of your data
- Context filter. After adding a filter, right click on it and select “Add to Context”. This filter will now be computed before any other you might have in your view
- Filter on dimension. Your normal “blue pill” filter
- Filter on measure. Your normal “green pill” filter
- Date filter. A normal date filter, with date used either as a blue or as a green pill
- Calculation filter. The filter that results out of making a calculation in your view
3. There are two kinds of groups: dimensional groups and visual groups
Dimensional groups are created by selecting the headers of the fields you want to include in the group. The members of a dimensional group are automatically combined in one field that Tableau renames by adding the field names together. Right clicking on dimensions in the dimension card and adding them to a group also creates a dimensional group. This is the type of group you should use if you want the fields to be combined; for example, if there are misnamed fields in your data that are separate when they should be together.
Visual groups are created by selecting the marks (your bars, or shapes or points) you want to include in the group. The members of a visual group are NOT automatically combined. What Tableau does instead is to give one colour to the member of this group and another to all the other marks in your view. This is the group you should use if you want to highlight the members within a group but don’t want to combine them.