On Day 2 of Dashboard week Andy asked us to explore Google’s copyright removal reporting data. Although Andy said it would be really really dumb to try and download, after a lot of searching around we could only find one big green ‘DOWNLOAD’ button which seemed to include ALL the data! Even though we co-ordinated our downloading and shared the data on USBs we still managed to break the internet. Whoops, sorry Andy! Off to a good start…
The challenge – too much data?
Looking at the size of the zip file we downloaded and considering how long it took to download. We knew that our first challenge would be – the size of the data! We had over 20 million KB of data spread over 3 csv files. With our Alteryx workflows taking minutes to run – time was ticking, and big decisions had to be made! What data did I want to keep?
I decided to focus on the requests.csv file which listed all the requests to Google for the removal of URLs from different reporting bodies. This was the smallest file from the report at only 1.16 million KB (!) so I thought this was the best option in terms of time pressures and my sanity.
Still, this was a lot of data… so I decided to focus on one of the largest reporting organisations in the dataset – the British Phonographic Industry (BPI). This gave me enough data to work with but also gave me a focus for my analysis.
Data Prep – (Thank god for cache and run!)
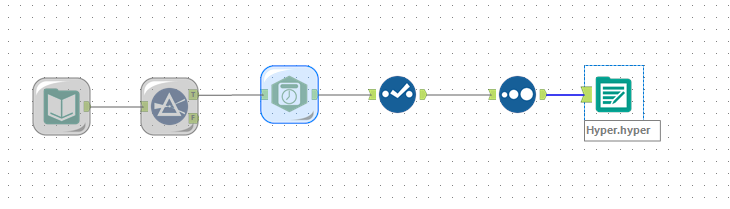
Luckily when I finally viewed the data in Alteryx, it was clear that it didn’t need to much cleaning or preparing, the only steps I needed to take were to filter by the reporting organisation so my data only included BPI’s removal requests and parsing the data into a usable format and exporting these into a much smaller Tableau Hyper for use in Tableau. Using Alteryx’s ‘Cache and Run’ workflow function was a real time saver here with so much data!
Exploring the data and research
Unlike yesterday, the dataset for today was consistent across time which allowed for trend over time analysis. When exploring the data, I noticed that 2017 seemed to be the peak for removal requests from the BPI with a drop of requests and removals after this year.
I decided to do some research into why this may be the case and found out more the landscape of copyright infringement in music as well as BPI’s anti-piracy strategy. In 2017, BPI had partnered with Google and other search engines to quickly remove links to unauthorised music sharing websites. Also in 2017 BPI reported that the world biggest ‘stream-ripping website’ YouTube-mp3.org was shut down.
Design
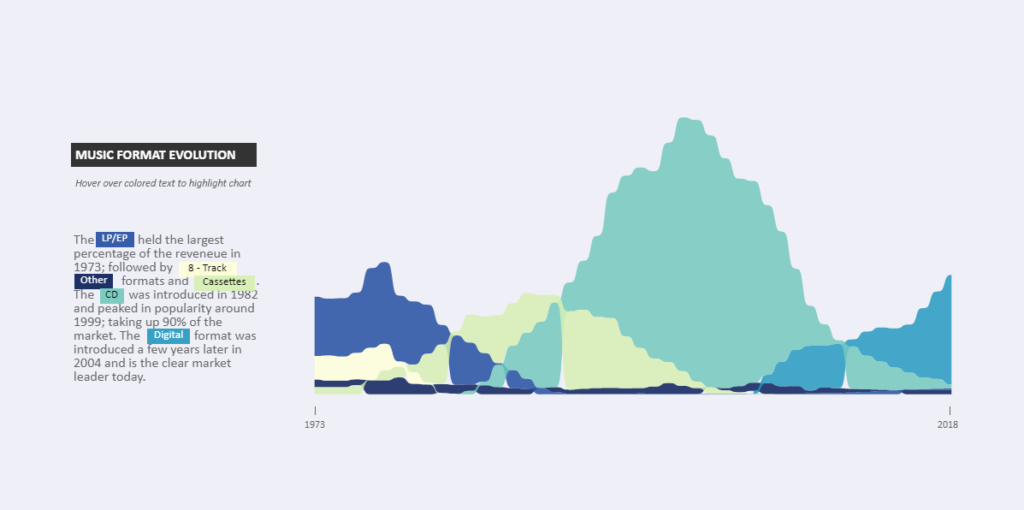
Whilst looking for some music inspired dashboard, I came across some clean, modern visualisations by Robert Janezic which were definitely an inspiration. In particular this visualisation which charts the use of different music formats.
My visualisation
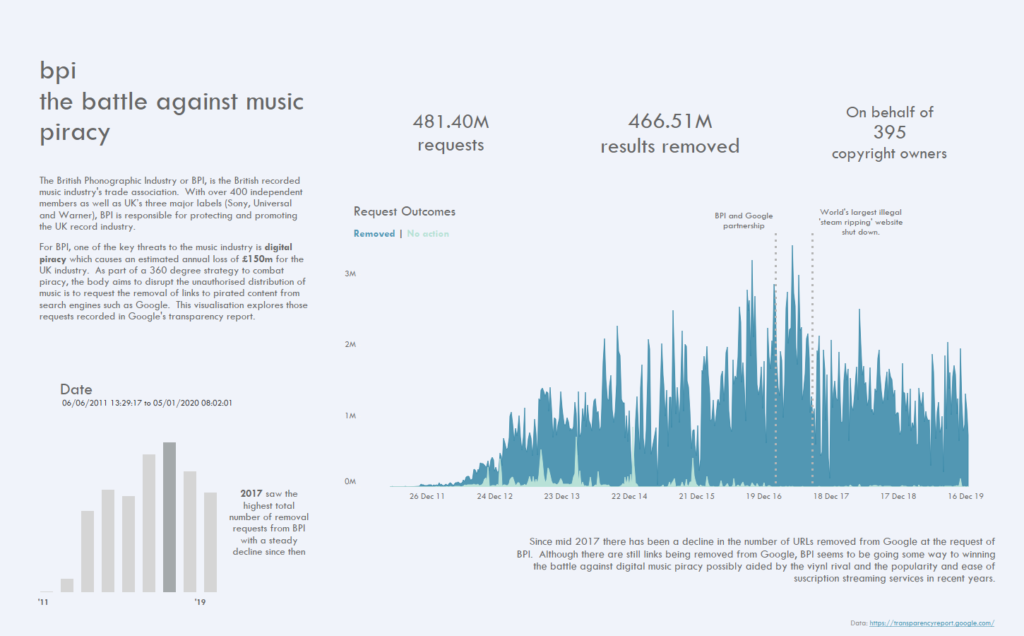
And below is the final result which looks at the trends over time in the link removal requests. A couple of insights were:
- Removal requests seem to peak in 2017 and decline after
- There were a few cases in which no action was taken on a URL removal request, this seems to have stopped almost entirely after BPI and Google partnered in February 2017
- Link removals have also followed a declining trend in the last two years – BPI could be winning the battle against piracy however external factors also need to be considered.
If I’d had more time I would have liked to have explored this trend in conjunction with the popularity of subscription streaming services and the vinyl revival and explore whether these really had an impact.