I had a big learning experience whilst preparing my gymnastics data, regarding how to effectively set out data for use in Tableau. Question: what should your data look like for use in Tableau? Answer: it probably depends, but I can at least tell you what I learnt from my first experience of self-led data formatting in Alteryx.
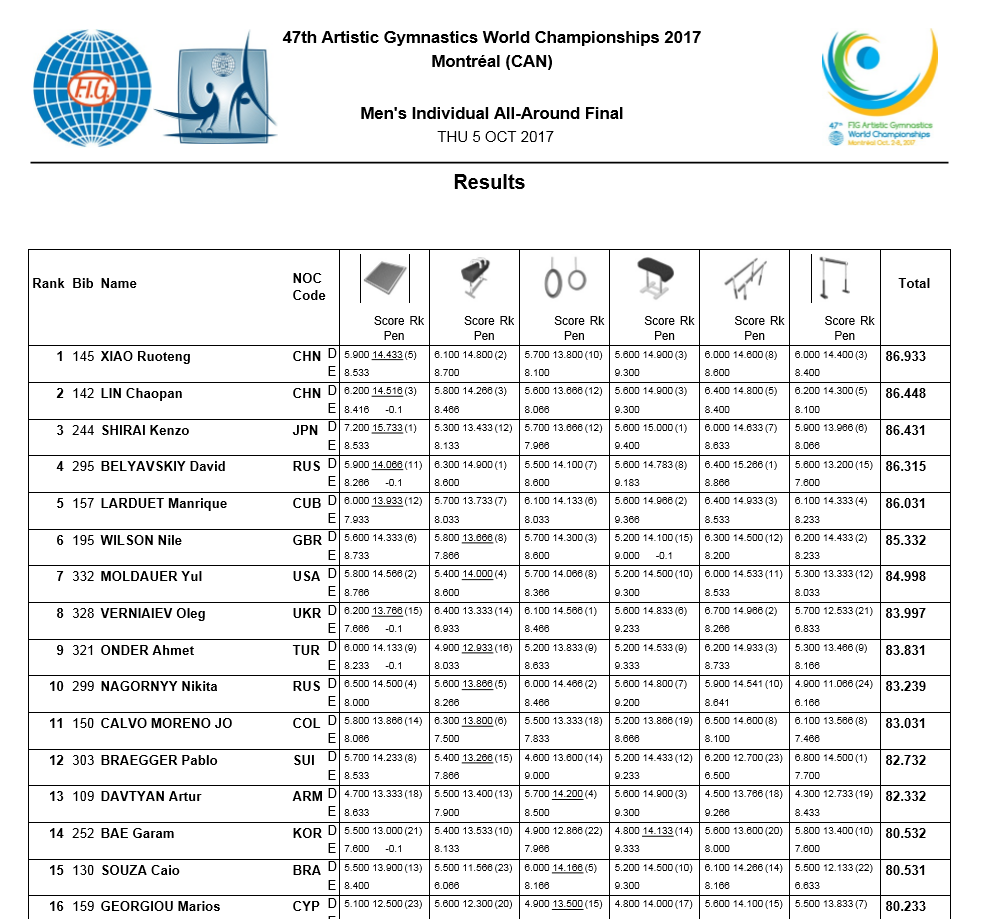 Data source: https://mtl2017gymcan.com/en/results/
So, how did I get from this terribly formatted PDF file to something usable for finding interesting insights in Tableau? I won’t take you through every detail of each iteration because we’d be here forever, but I’ll highlight a few key points that showed up as important through the process. I’ve added comments to each tool in the final workflow so that you can follow through the logic.
Version 1

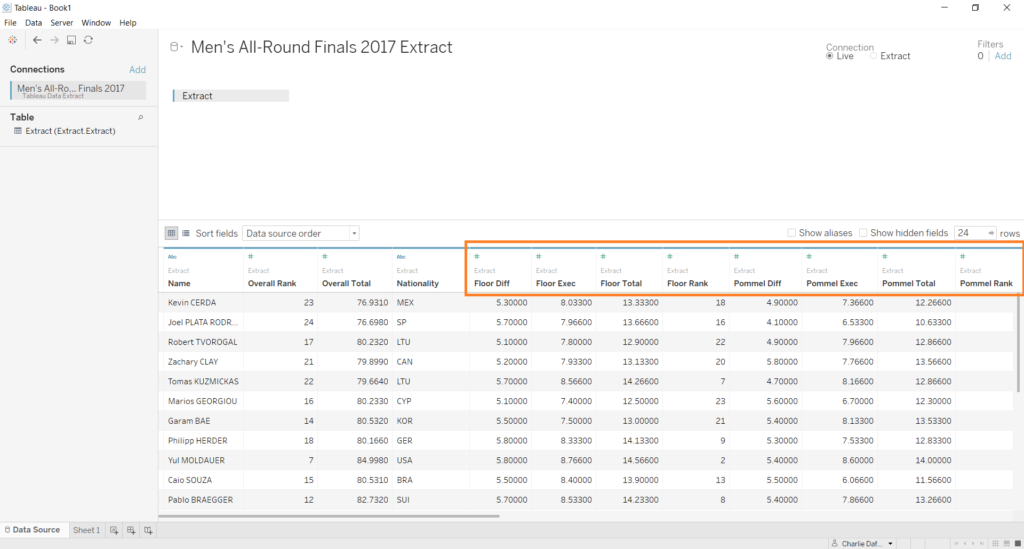
No good. I was pretty pleased with myself when I got this ‘all sorted out’ in Alteryx, only to load it into Tableau and realise within about five minutes that it wasn’t going to work. I hadn’t set it up well in terms of creating distinct dimensions and measures. I wanted to be able to filter and colour by apparatus, and this set-up didn’t allow for that since there wasn’t an apparatus field. The names were also suspect, but I realised that I had to go back to the drawing board anyway so these were fixed during later iterations.
Version 2
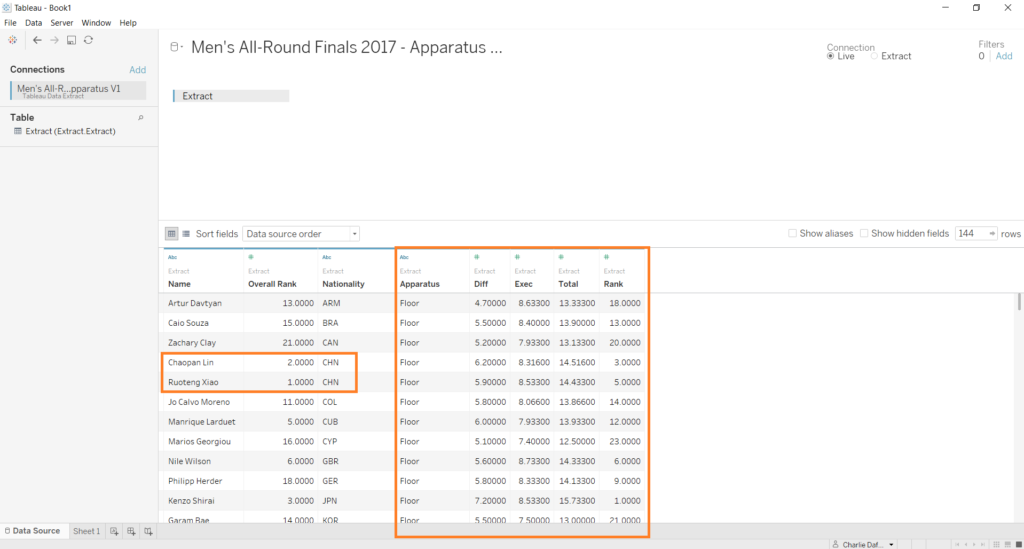
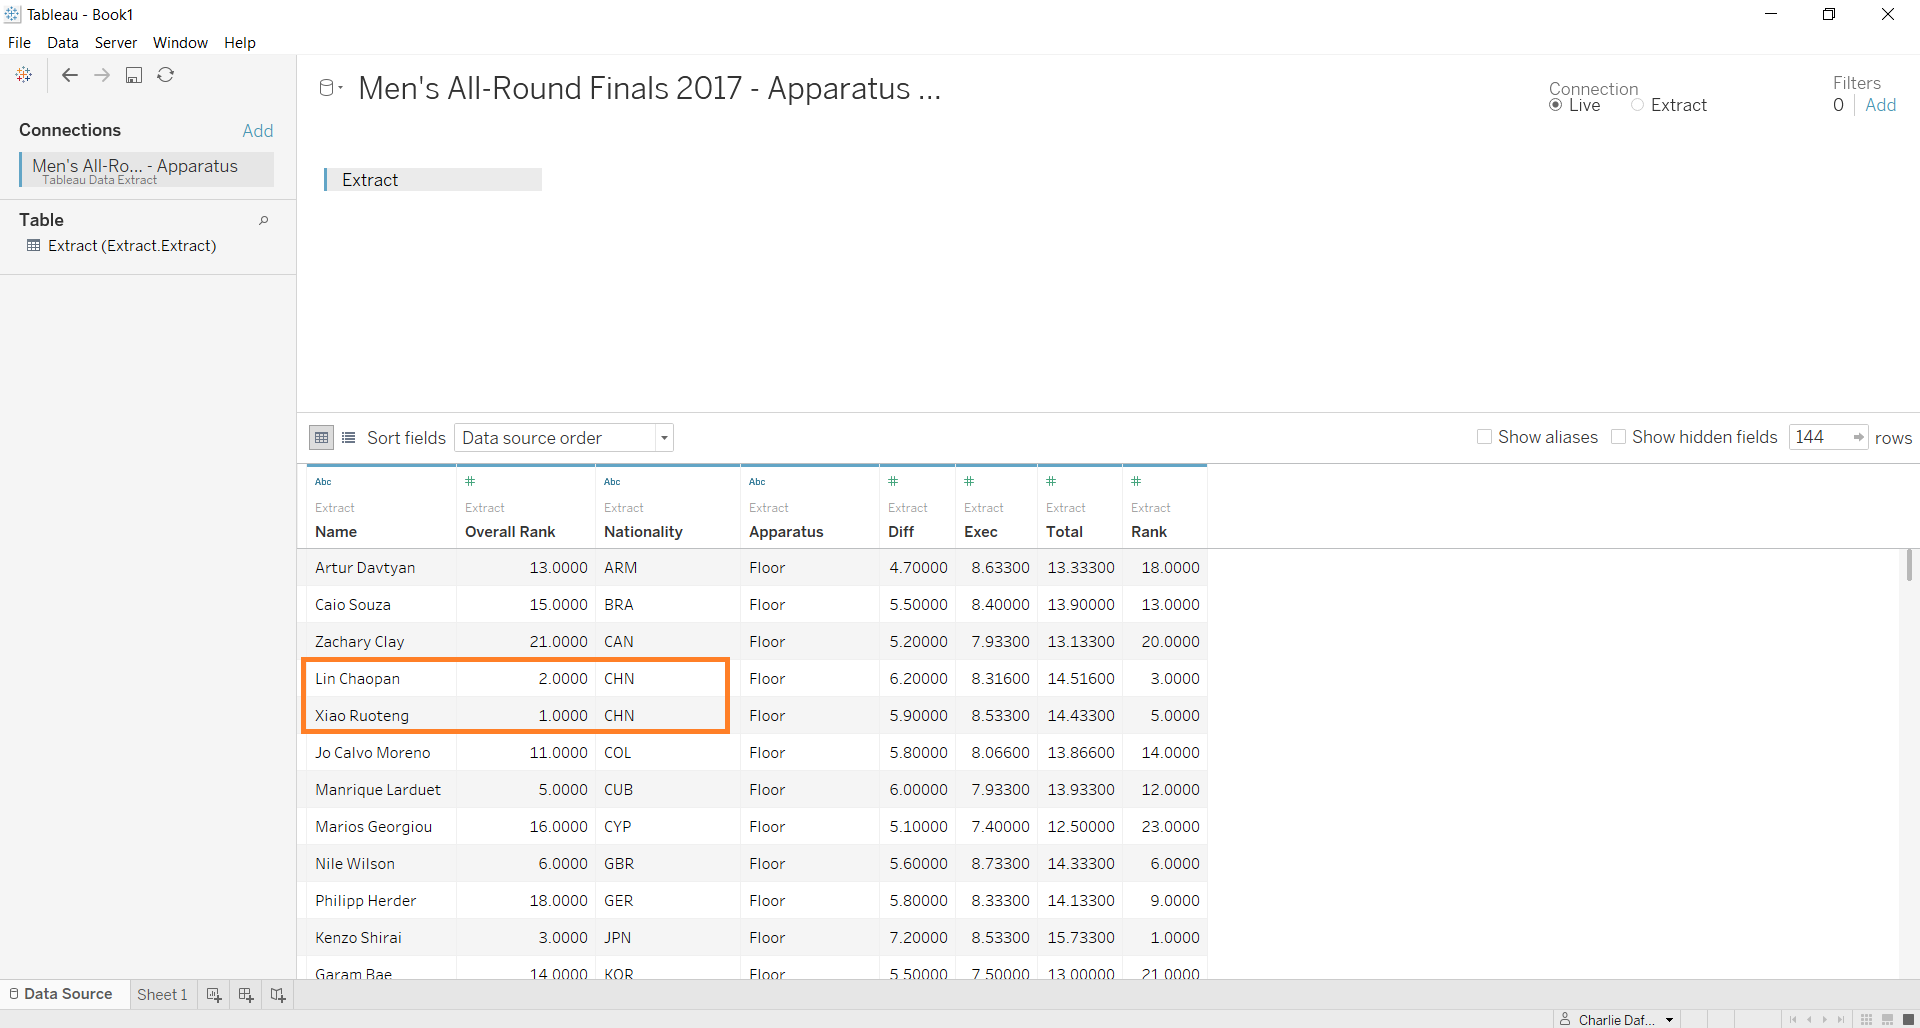
Better! By pivoting much earlier in the Alteryx workflow I could get apparatus into its own field, which meant that I was able to create plots split up or coloured by apparatus. Great. I also worked out the ‘TitleCase’ function in Alteryx, so the names field is looking better. (TitleCase examples: ‘Nile WILSON’ becomes ‘Nile Wilson’, and ‘manrique larduet’ becomes ‘Manrique Larduet’. Very handy.)
However, there’s still a flaw in the names field – the names of the Chinese athletes are the wrong way round, due to the fact that family names and first names are differently ordered in that language. Chaopan Lin should be displayed as Lin Chaopan, and Ruoteng Xiao should be displayed as Xiao Ruoteng. This was where it became very useful to have some personal knowledge of the subject of the data set; I think this is something that would have been easy to miss if I hadn’t watched hours of the competition online. So, the third iteration of the workflow came about.
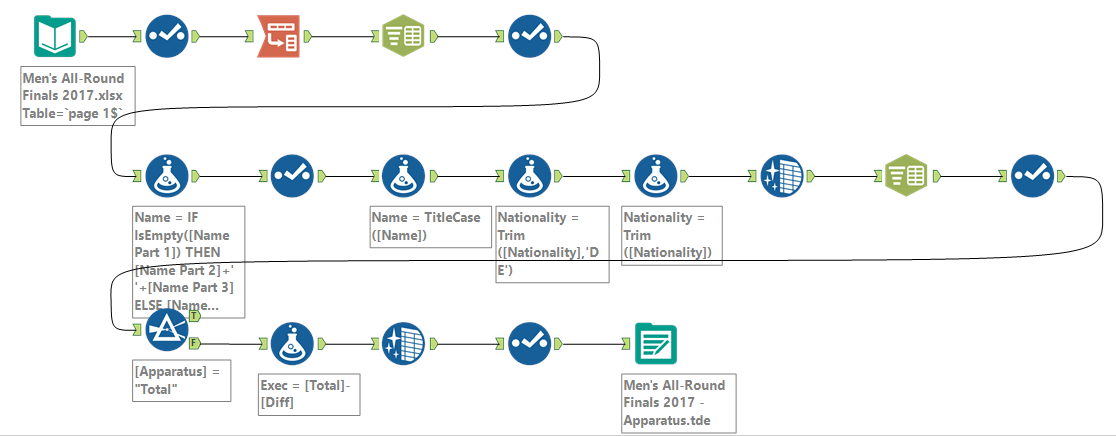
Version 3
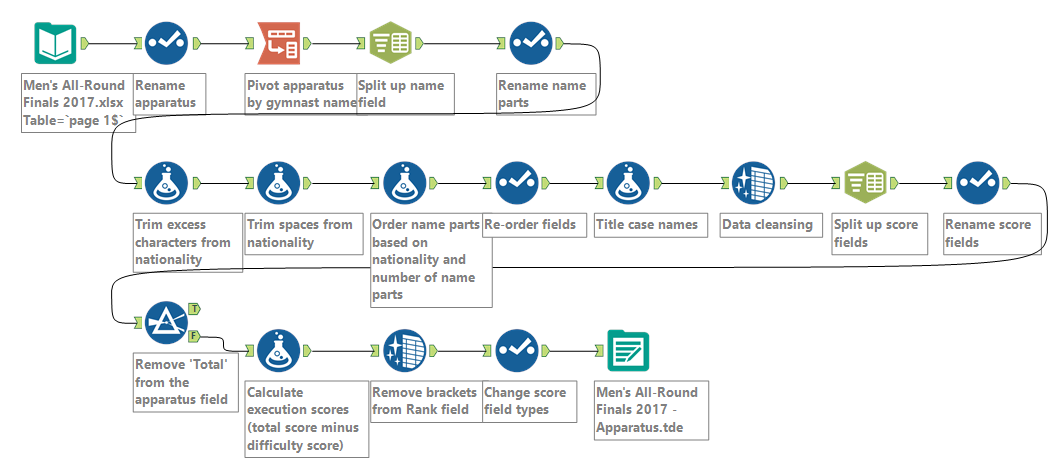
This is mostly a change in one tool, but I started a new workflow just in case what I was trying to do was a monumental failure. Having used a Text To Columns tool to divide the initial names column from the PDF file, I had three different name part columns. This was due to the gymnasts with three names (e.g. Jo Calvo Moreno) – one of the columns was empty for most of the entries, as most gymnasts only used two names. I set up the formula tool as an IF statement, which considered firstly whether the athletes were of Chinese nationality (to identify the special cases which required different name ordering), secondly if the third name column was empty (to identify cases where only two of the columns needed to be included), and finally if the third name column was occupied (to deal with the special case of athletes with three name parts, which needed to be ordered differently to those with only two name parts). It works something like this:
IF Nationality = Chinese, then Name Part 3 = first name + Name Part 2 = second name.*
ELSEIF Name Part 1 is Empty, then Name Part 2 = first name + Name Part 3 = second name.
ELSE Name Part 1 isn’t Empty, therefore Name Part 1 = first name + Name Part 3 = second name + Name Part 3 = third name.
END
*This only works because the Chinese athletes each only have two names. The whole thing took some research into how the names of gymnasts needed to be ordered to make sure that I laid out the name parts correctly, plus a little trial and error, but I got there in the end.
Finally, success! I’ve now played about in Tableau with this version of the data set a fair amount, and haven’t had any problems with how it’s formatted. I think that the moral of the story is: think about what you want your data to look like before you start doing! I’m sure that this is something that will improve organically with experience, but I could’ve streamlined the whole process of dealing with my data if I’d sat down to consider the ideal end point before I started. You live and learn.
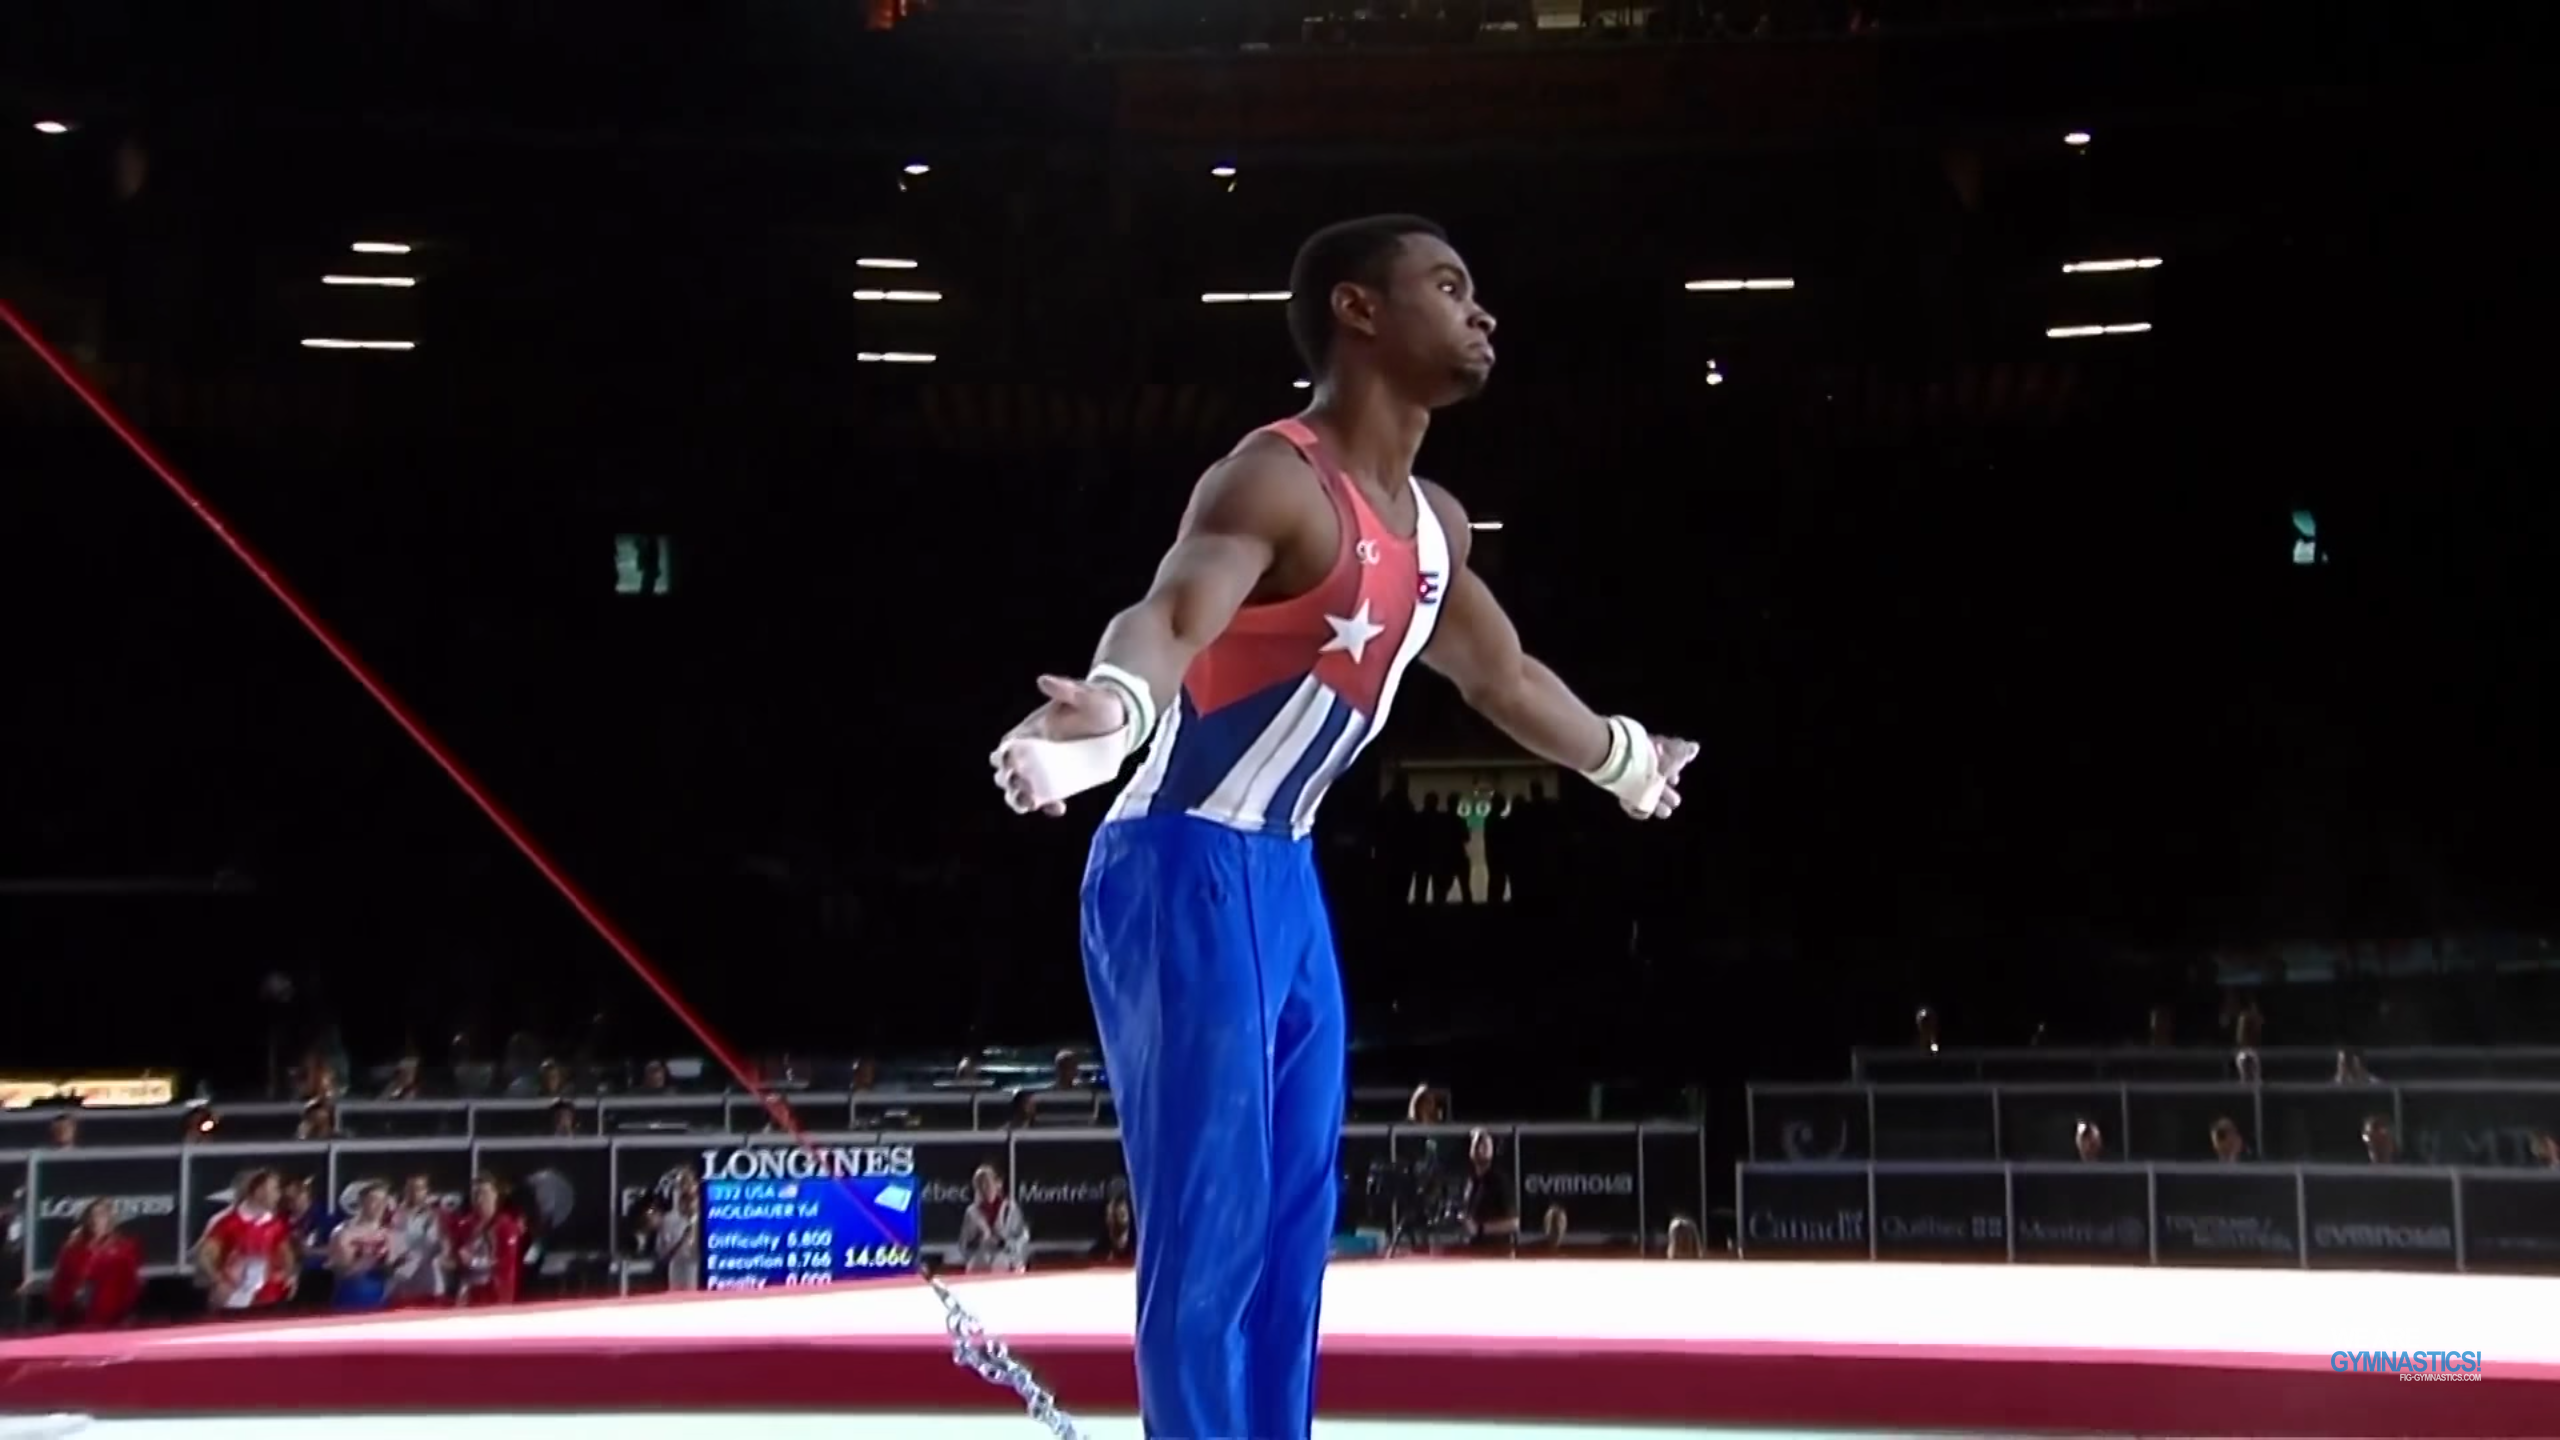
[Image: Manrique Larduet shrugs after sticking the landing of his high bar routine – for which he received the fourth best score on that apparatus in the all-around final, securing his fifth place overall finish. But no big deal.]