Want to compare two different measures against the same axis? Have you considered creating a graph with bars within bars?
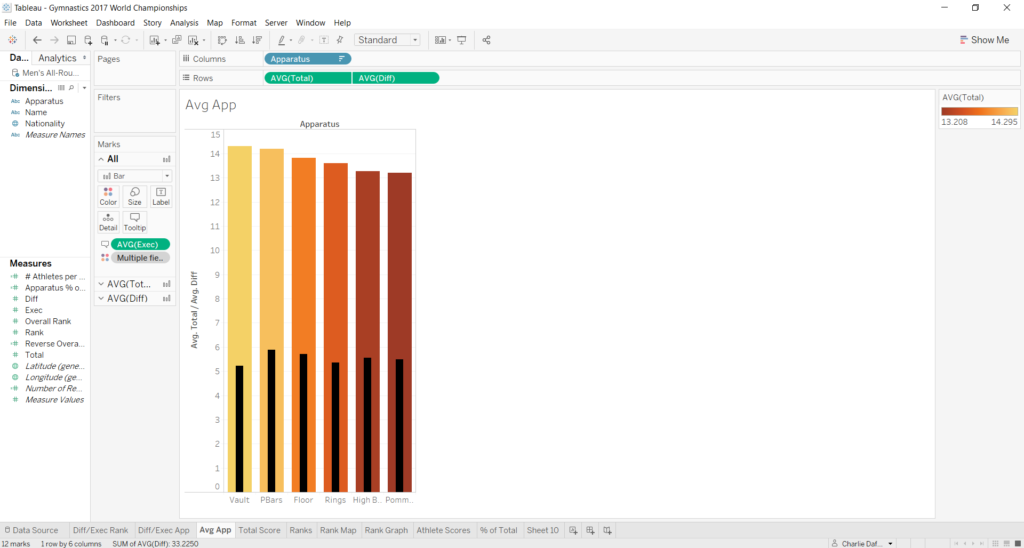
In my gymnastics data set I wanted to take a look at how the average totals scored on each apparatus compared to the average difficulty posted on each apparatus. In the final graph that you see here, the total scores are illustrated with the larger bars, whilst the constituent difficulty scores are shown by the black bars.
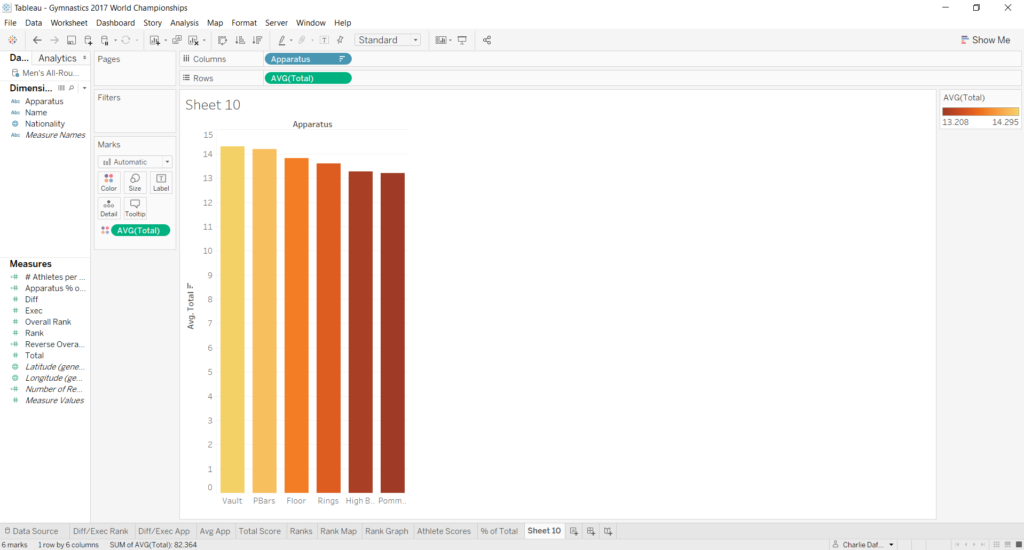
How did we get here? Your basic starting point is a simple bar chart with a dimension on columns (apparatus) and a measure on rows (average total).
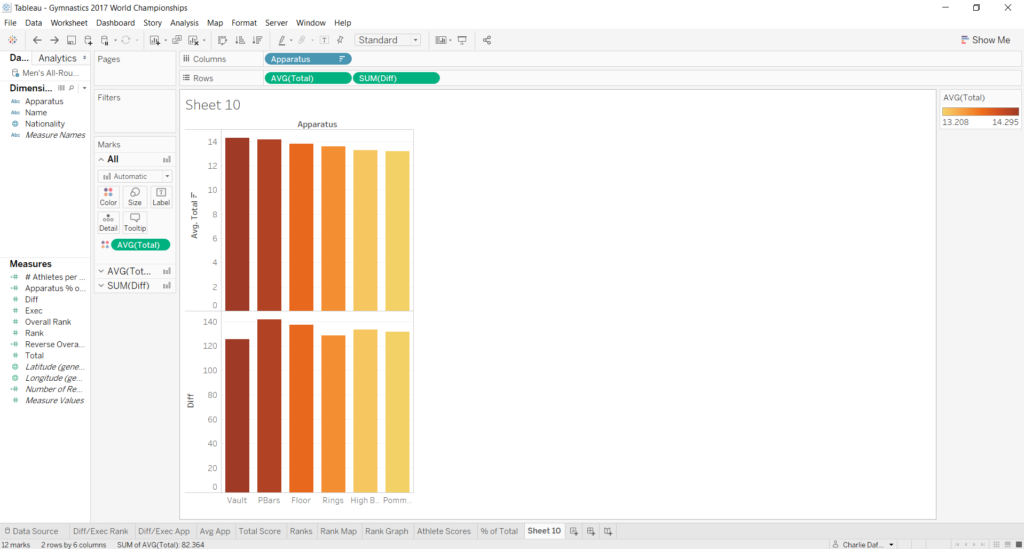
Now we add the thing we want secondary bars for onto the rows shelf – in this case Diff.
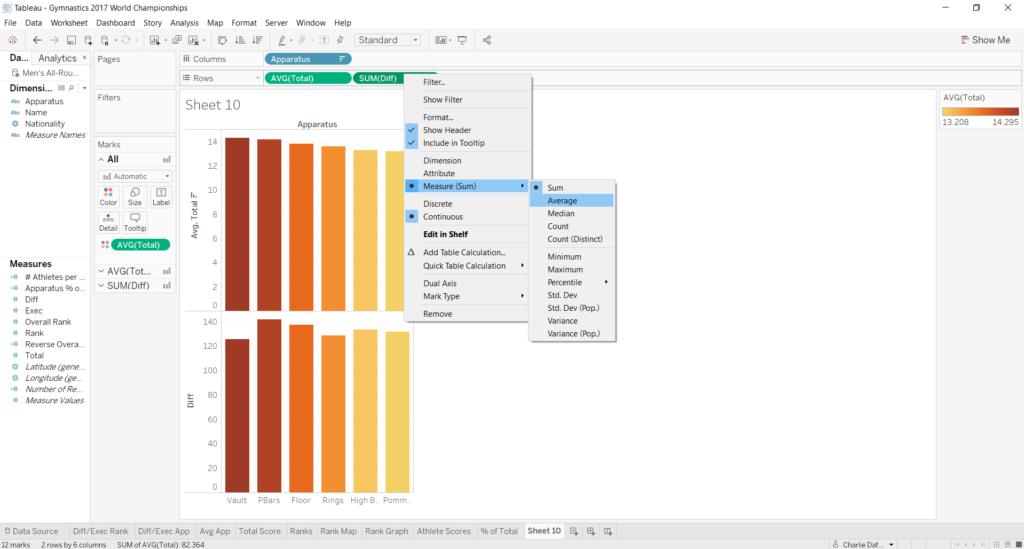
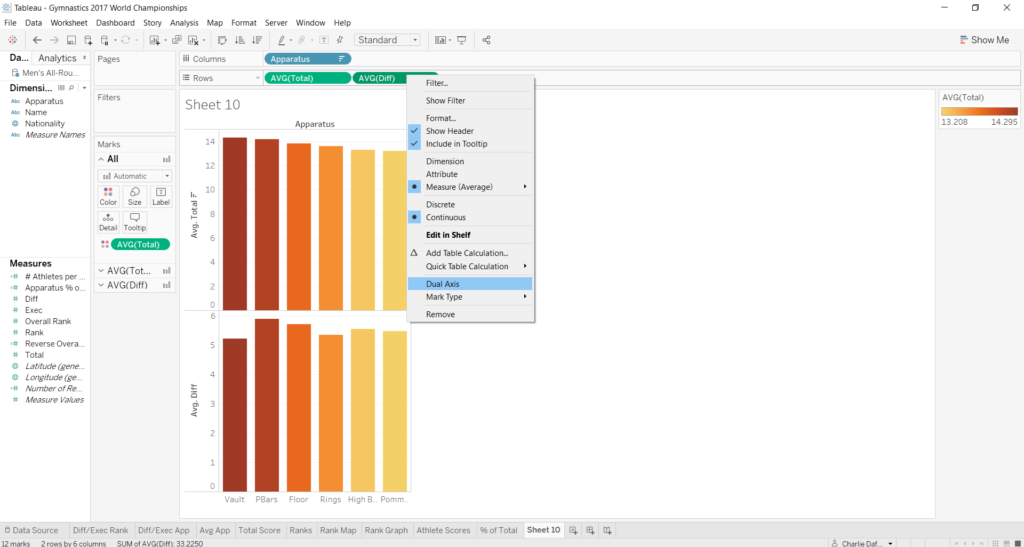
And make sure that correct aggregate is being calculated! Mine defaulted to SUM, but I want AVG, so I’ll just right click on the Diff pill and change the Measure (SUM) to Average.
Next up, right click again and select the Dual Axis option to get the display all together.
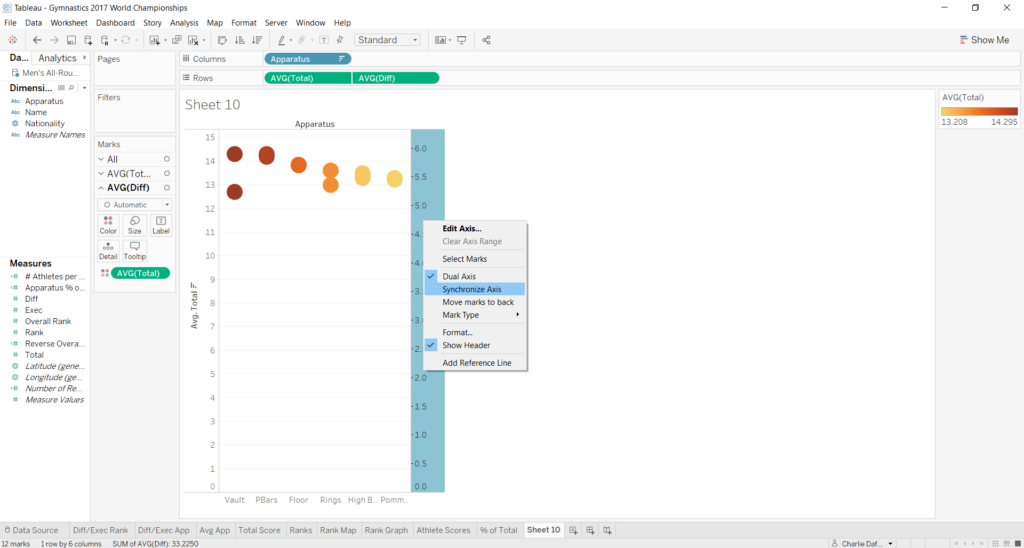
This time, right click on the axis, and select the Synchronise Axis option to ensure that both measures are being displayed with reference to the same scale.
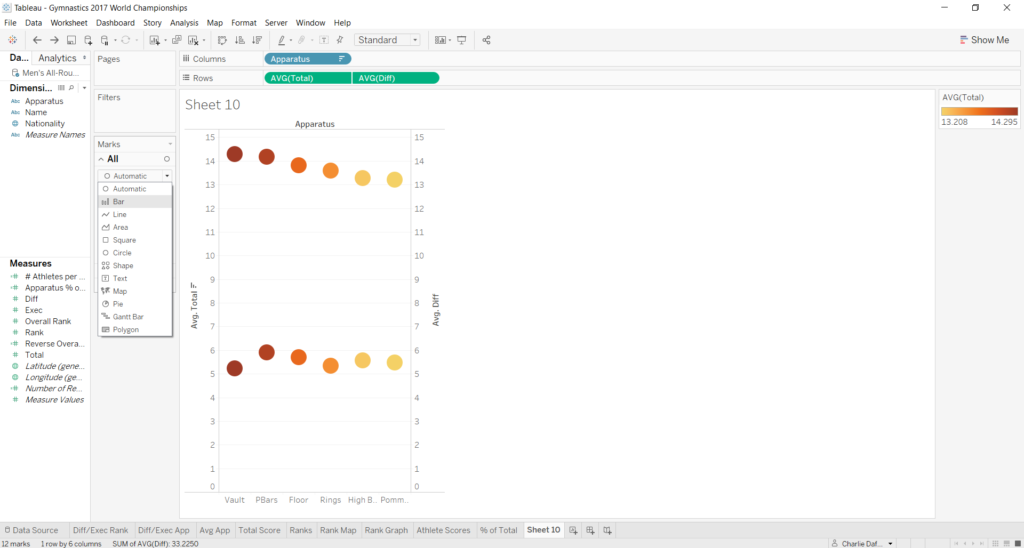
Now, we don’t want dots, we want bars. Under the ‘All’ section of the marks card, change the mark type from automatic to bars.
Then go to the section of the marks card for your secondary bars. I’m going to remove average total from the colour marks and change it to plain black, but you can play about with colours however you like.
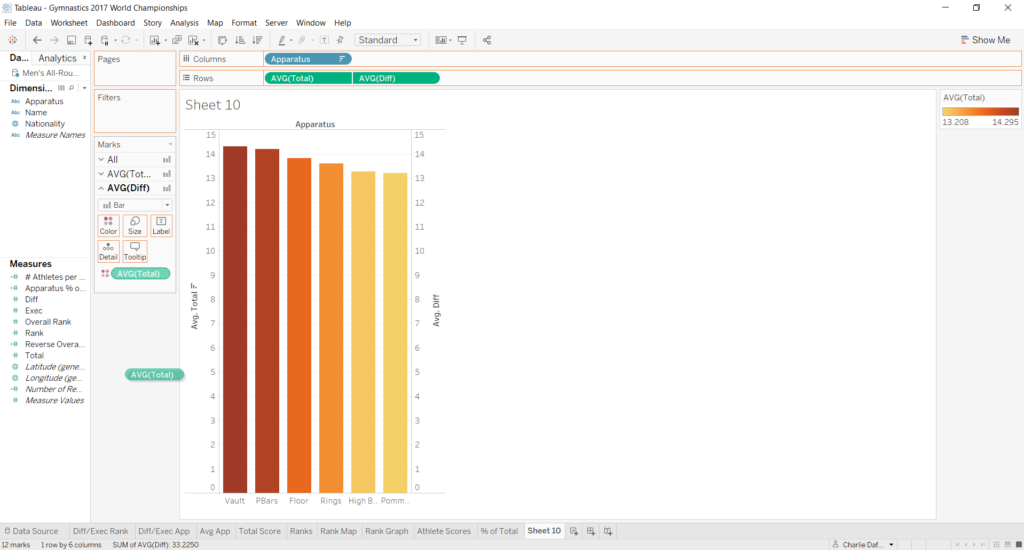
We just need to use the same marks card to shrink the size of the secondary bars – this reduces the width of the bars, so that they’re nicely contained within the main bars.
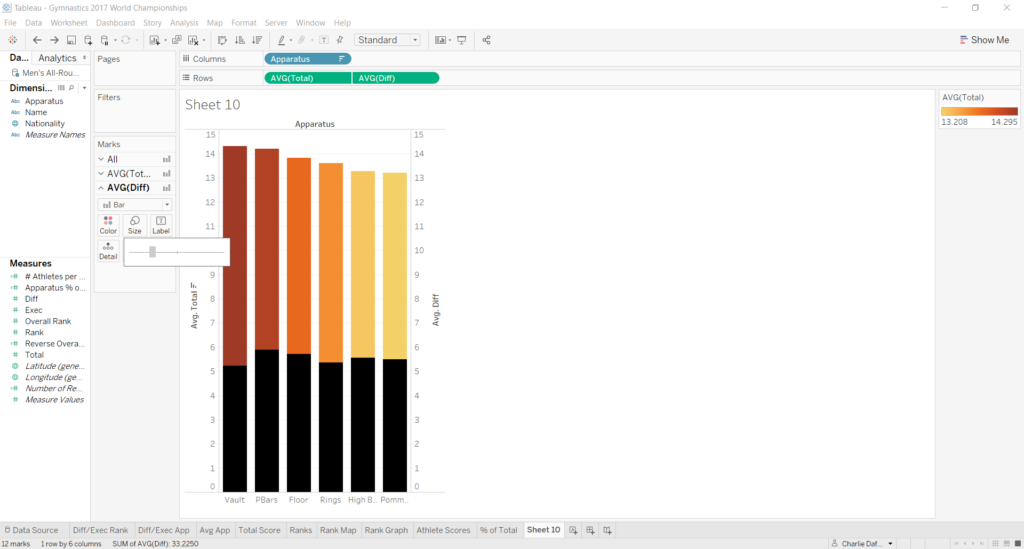
Finally, you should probably do some cleaning to finish up the chart, e.g. right clicking to remove the header from the secondary axis, and right-clicking to rename the main axis.
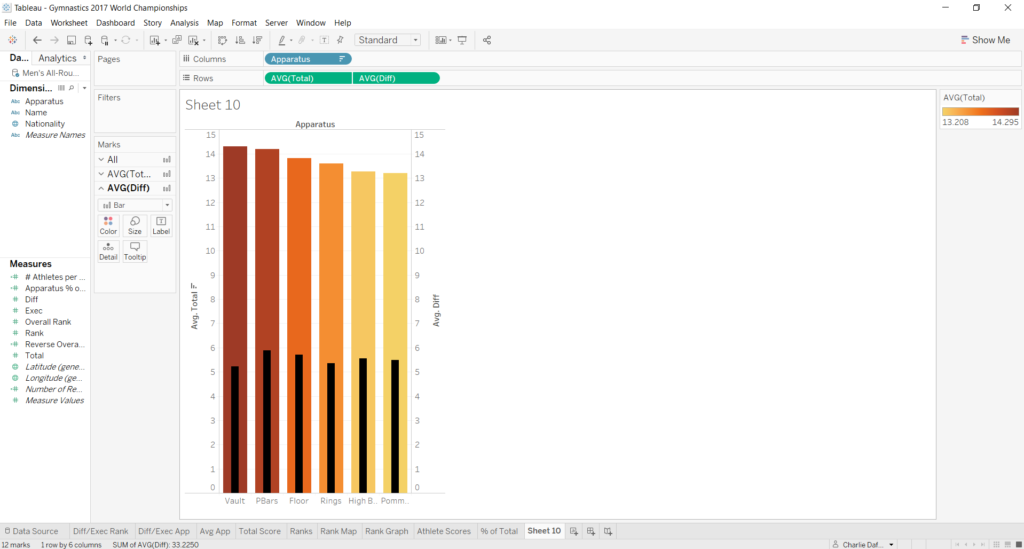
Voila! You’ve got yourself a chart of bars within bars.

This graph throws up some interesting facts! Although vault is the highest scoring apparatus on average, it’s also the apparatus where gymnasts post the lowest average difficulty value – this means that they’re tending to execute incredibly well. High bar difficulties tend to be greater than rings difficulties, but high bar has lower average scores due to execution errors. As well as the usual deductions for execution and landing faults, there’s also a chance of falling from the high bar during release elements, a risk that isn’t present on the rings. Ditto pommel horse!