


Filtering is a powerful tool in Tableau and most users will have probably used it to slice and dice their data. But, did you know that Tableau handles dimension and measure filters differently? Today, we'll take a look at the basic anatomy of filtering in Tableau and how the filter settings for various categories of data differ.
Dimension Filters
If you've read my last blog, you'll recall that dimensions are often dis-aggregated and discrete values. From the Superstore sample dataset, dimensions include variables such as 'Category' and 'Sub-Category.' For our example, we'll experiment with filtering the Sub-Category field.
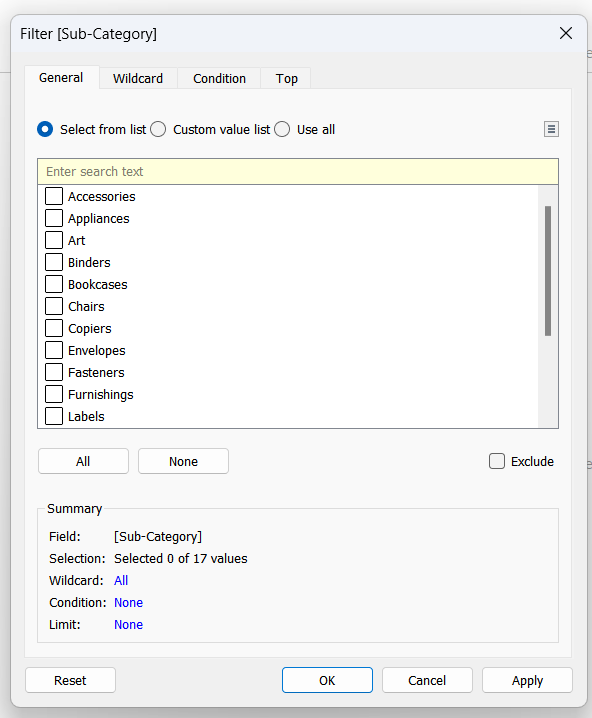
If you take a look at the filter menu below, you'll see four options along the top (General, Wildcard, etc). These options allow you to use a combination of manual selections, custom inputs, Boolean string parameters, and quantitative conditions to filter the data. Be aware that these four filtering options will run concurrently if you have them specified. If not careful, these filters may conflict or override one another.
The best way to check whether you have multiple filters is to check the 'Summary' pane at the bottom of the menu. This pane provides a complete roll-up of all the filter actions that were specified, giving you an easy way to account for filters.
Finally, under "General" filters, users have the option of excluding values. Why might one exclude, rather than include, in their filters? Let's say this dataset is a live dataset that's being updated periodically and the company decided to add a new sub-category. If we filter based on inclusion, the new dataset will not add the new sub-category to the filter because the new value wasn't explicitly included. On the other hand, if we filter based on exclusion, Tableau will append the new sub-category to the view because the new value wasn't explicitly excluded.
With the basics of dimension filters covered, we'll move onto measure filters next.
Measure Filters
Measures, which are often aggregated and continuous variables, are filtered a bit differently. Let's take the example of 'Profits' from the Superstore dataset.
The below is the filter menu for profits. Looks a little different, doesn't it? This is because the Profits variable is being treated as a measure and Tableau needs to know how to aggregate Profits.
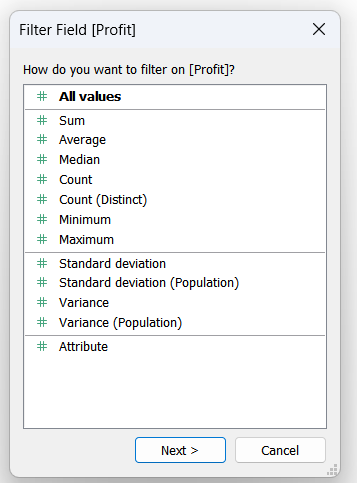
The exception to this is the "All values" option at the top. If you've read my last blog, you may have an idea of what "All values" will do. To illustrate this, let's take a look at two filter examples.
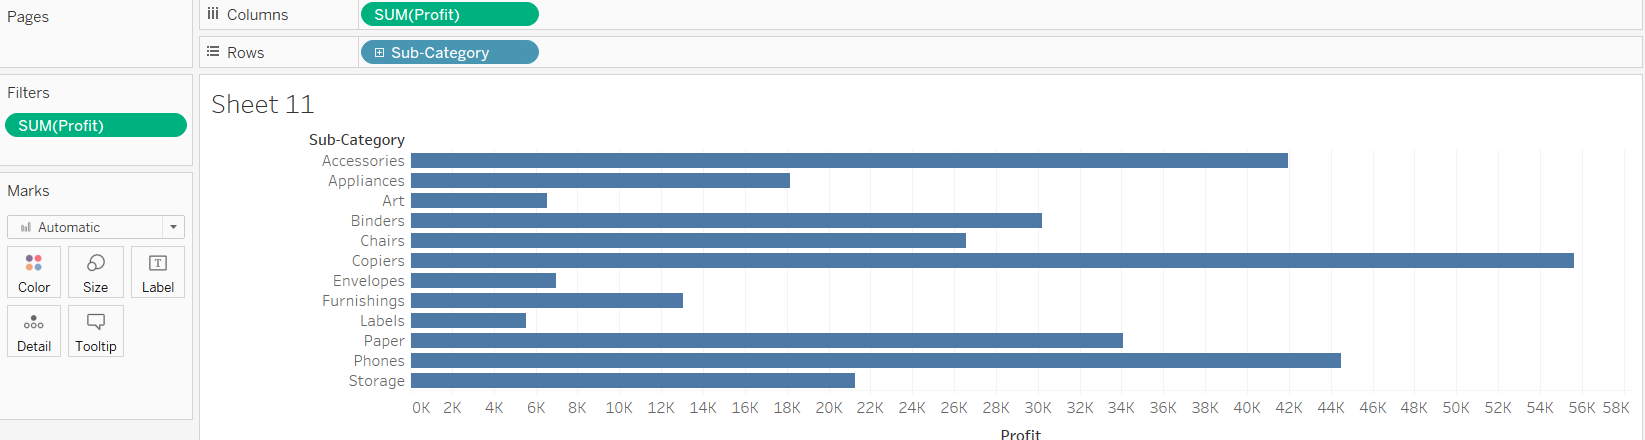
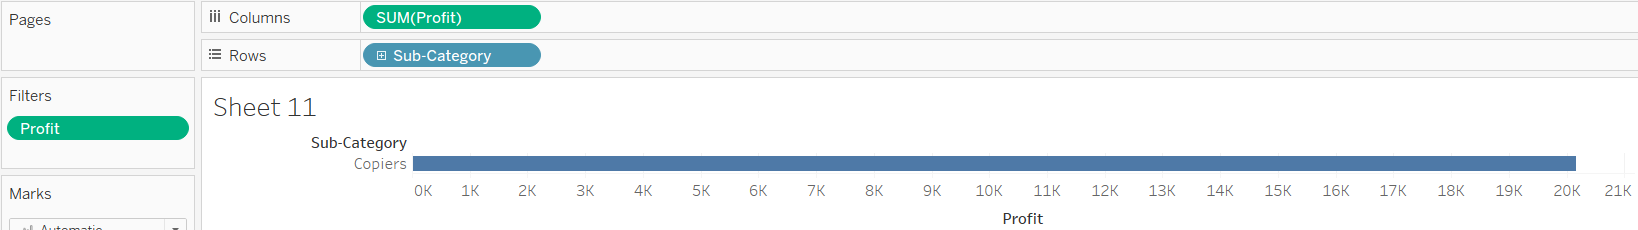
As you'll notice, we are filtering both charts by sub-categories with profits above 5,000. The results, however, are vastly different.
The results are different because of how we aggregated, or didn't aggregate, profits. In the first chart, profits were not aggregated (we selected "All values"). Hence, Tableau is filtering based on the lowest level of profits available in the data. If we add Row ID to the details of the first chart, we can see what 'profits' Tableau is considering.
At a lower level of detail, we can see that Tableau is filtering based on the profits of each row of data. The 'Copiers' sub-category is the only sub-category where profits exceeded 5,000 for certain transactions.
On the contrary, Tableau is filtering based on the aggregated sum of profits for each sub-category in the second chart. Therefore, every sub-category with less than 5,000 in total profits is excluded from the view.
I hope this provided an overview of the different filtering options between measures and dimensions!