


There is a known issue in some versions of Tableau where when using calculated fields from an extract with dynamic zone visibility or dynamic axis titles, refresh extracts fail. If you come across that bug, you might want to use dynamic zone visibility (DZV) without using calculated fields. Here's how to do it.
[Another alternative is to use chart swapping without DZV]

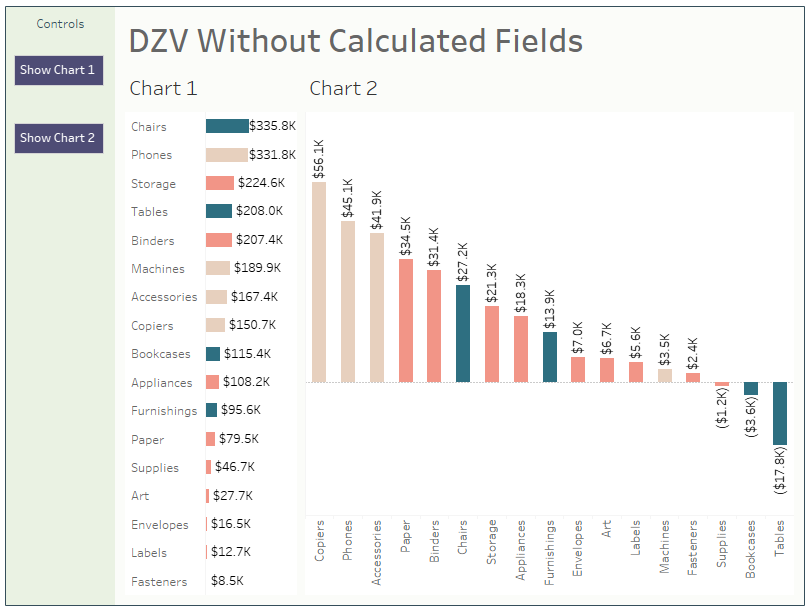
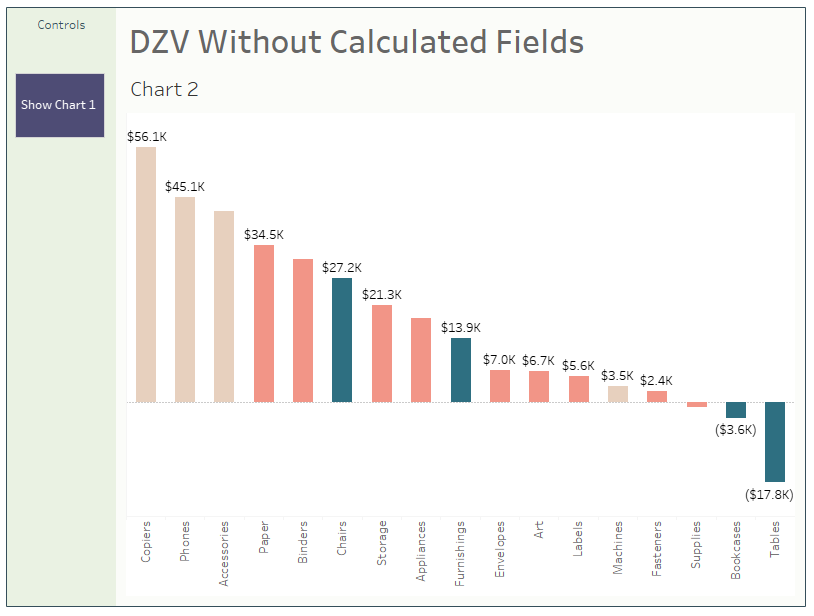
This tutorial shows how to switch between two charts using DZV without using calculated fields. This can be extended to more than two charts by creating more, more buttons, and more parameter actions.
- 1. Create the charts you want to switch between. Here, we will have Chart 1 and Chart 2.
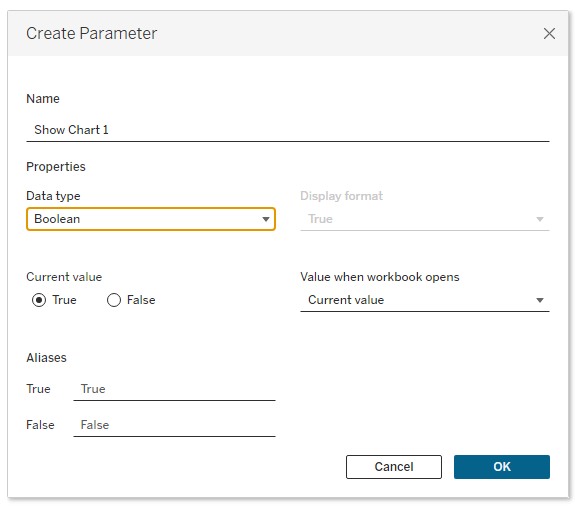
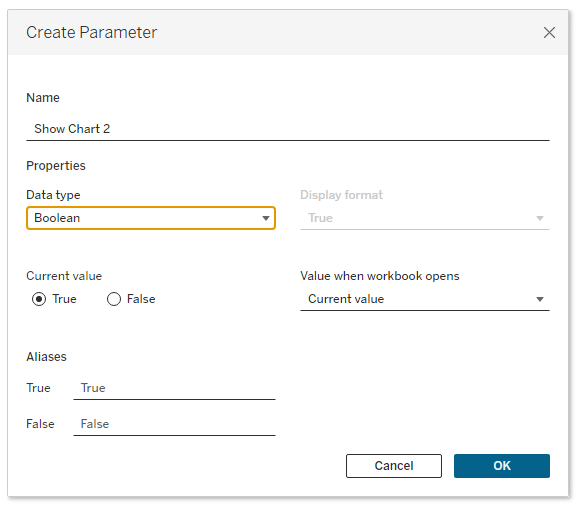
- 2. Create a Boolean parameter to control the visibility of Chart 1 and another to control the visibility of Chart 2. In this tutorial, we will call these Show Chart 1 and Show Chart 2.
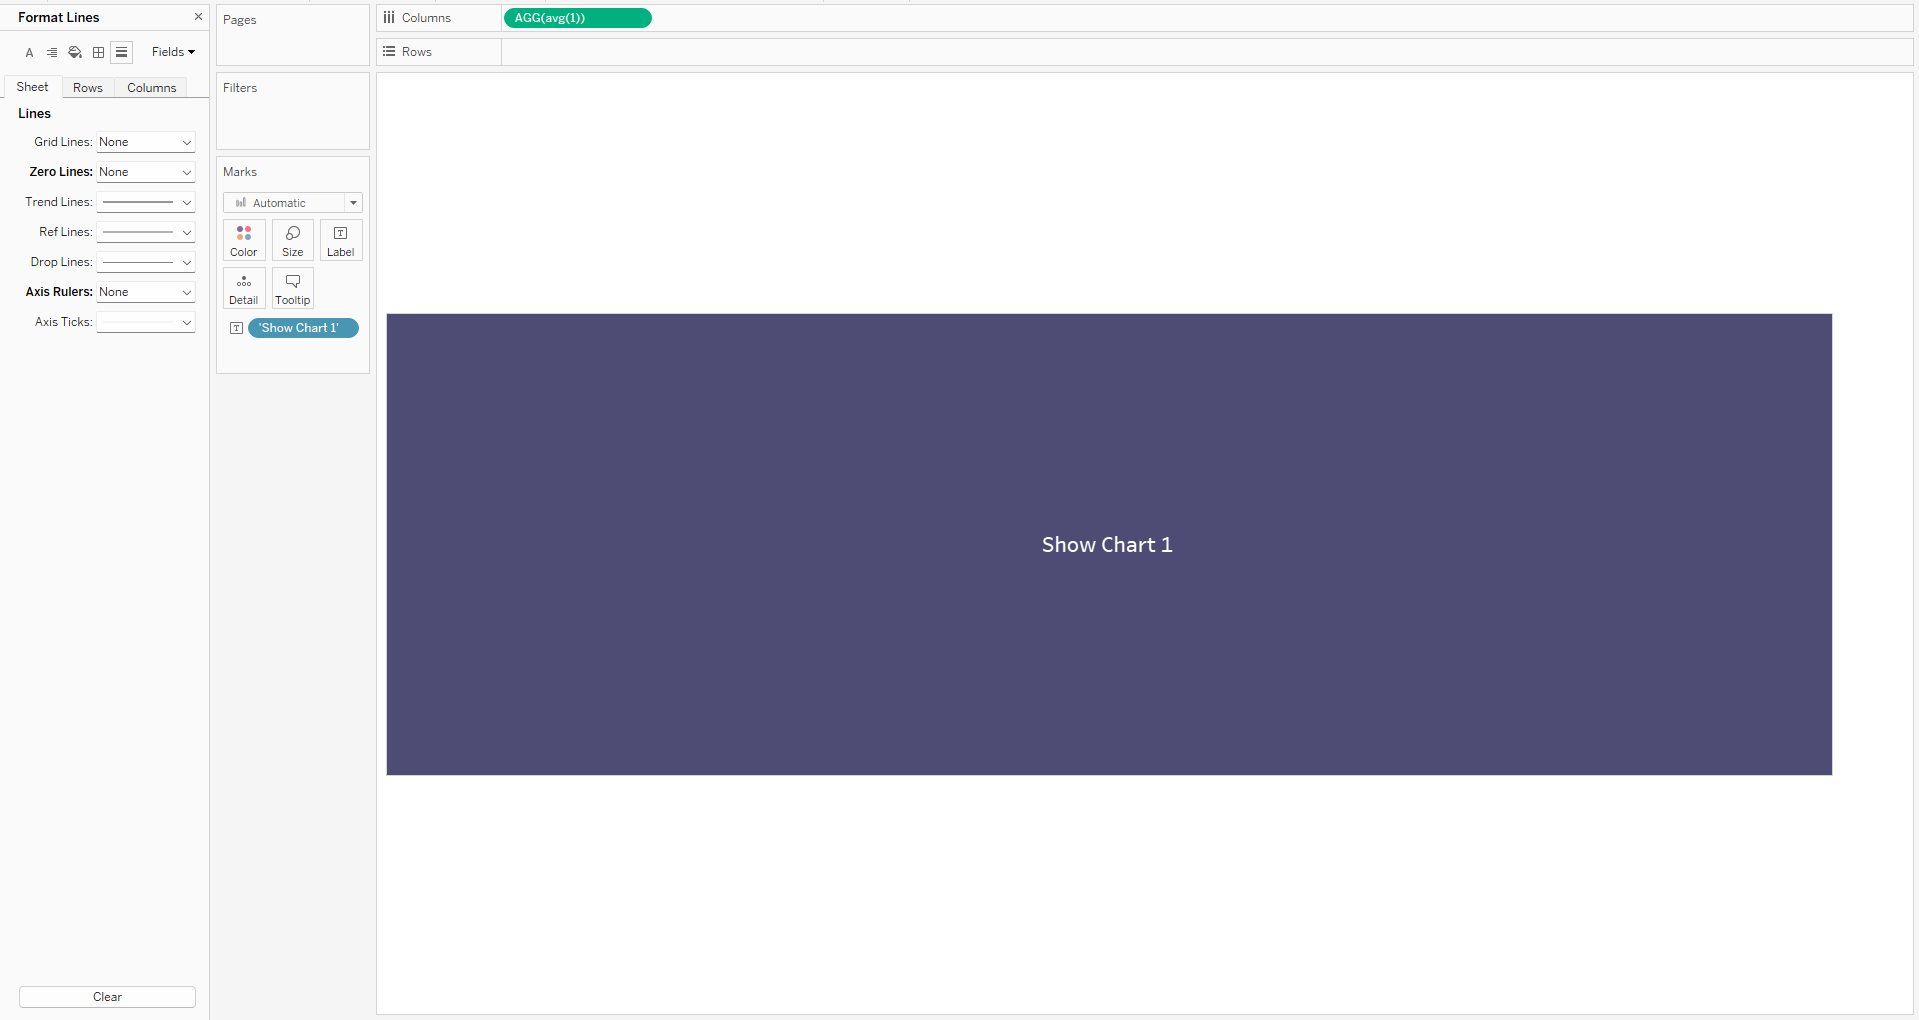
- 3. Create a new sheet to serve as a button to show chart 1. We'll call this sheet Chart 1 Button. Here's a basic button set-up:
- Double click the Columns Shelf and type avg(1).
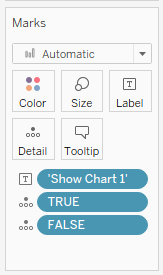
- Double click the Marks Card and type 'Show Chart 1'. Drag the resulting pill onto Label.
- Click on Label and set Alignment to Middle Center.
- Right-click the axis and uncheck Show Header.
- Right-click the title and select Hide Title.
- Set view to Entire View.
- Adjust color, size, and font size as desired.
- Right-click the sheet and select Format.
- Go to the Lines tab and set Grid Lines and Axis Rulers to None.
- Go to the Shading tab and set Worksheet to None.
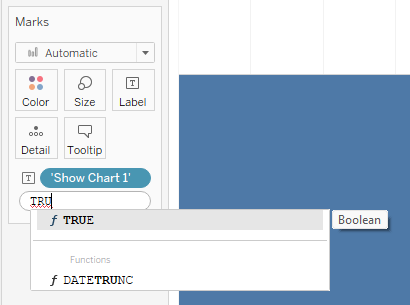
- 4. Double click in the Marks Card and type TRUE in the pill that appears. Do this again but with FALSE
- 5. Duplicate this sheet by right clicking its tab at the bottom of the screen. Change the title and text on the new sheet to correspond to Chart 2.
- 6. Add both charts and both buttons to a dashboard.
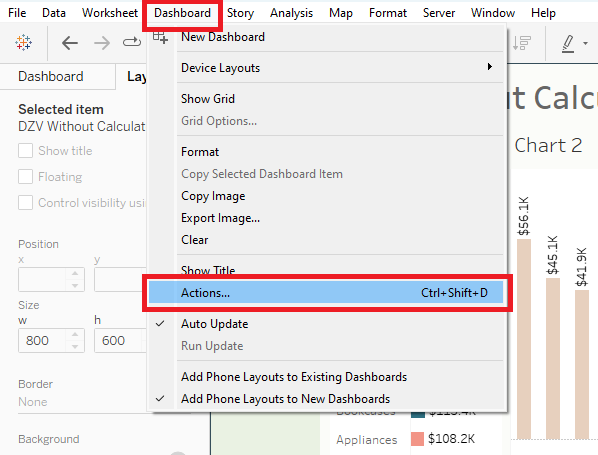
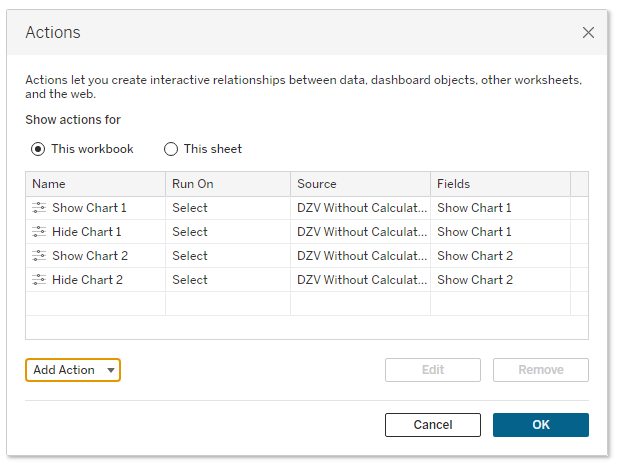
Now we need to set up dashboard actions to change the parameters as desired. Here are the actions and their configurations:
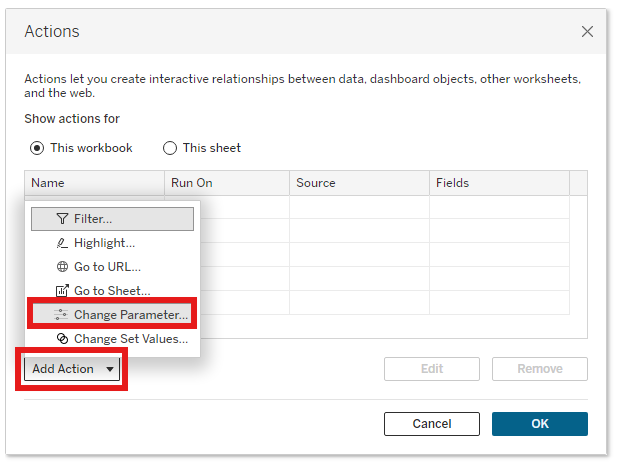
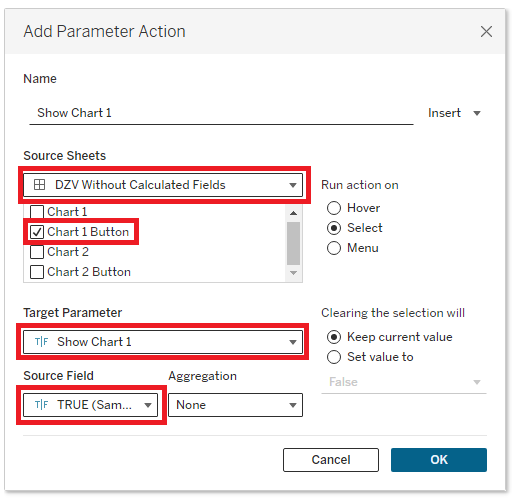
- 7. Set up a dashboard action to update the parameter to show Chart 1:
- Create a parameter action.
- Source Sheets: Select your dashboard in the drop down, uncheck everything but Chart 1 Button.
- Target Parameter: Show Chart 1.
- Source Field: TRUE
- 8. Set up a dashboard action to update the parameter to hide Chart 1:
- Create a parameter action.
- Source Sheets: Select your dashboard in the drop down, uncheck everything but Chart 2 Button.
- Target Parameter: Show Chart 1.
- Source Field: FALSE.
- 9. Set up a dashboard action to update the parameter to show Chart 2:
- Create a parameter action
- Source Sheets: Select your dashboard in the drop down, uncheck everything but Chart 2 Button.
- Target Parameter: Show Chart 2.
- Source Field: True.
- 10. Set up a dashboard action to update the parameter to hide Chart 2:
- Create a parameter action
- Source Sheets: Select your dashboard in the drop down, uncheck everything but Chart 1 Button.
- Target Parameter: Show Chart 2.
- Source Field: FALSE.
Next we set up the DZV to make the correct charts and buttons show or hide when the buttons are clicked.
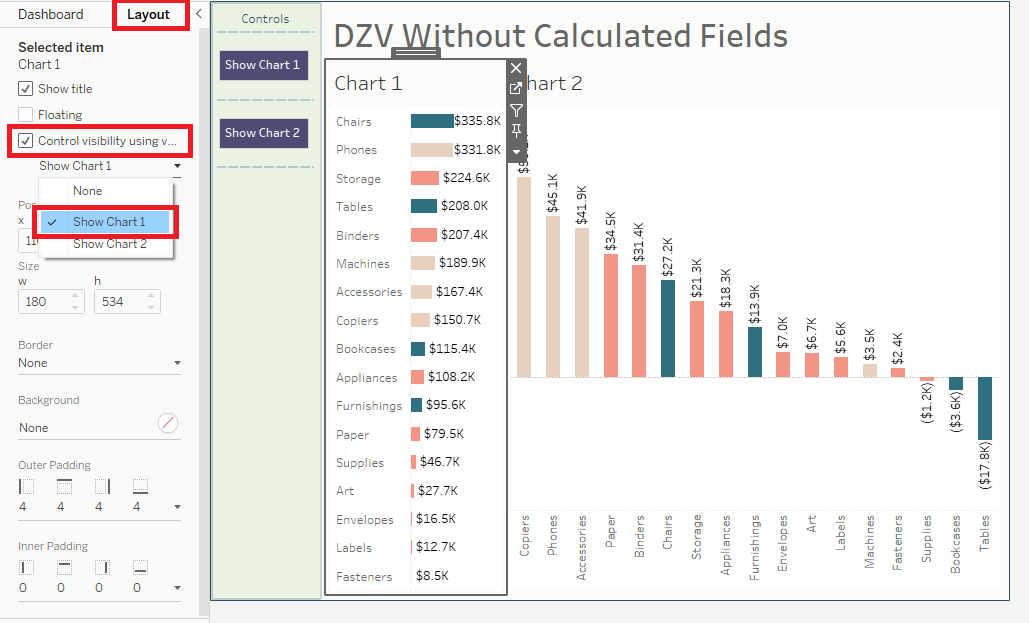
- 11. Set up DZV to control Chart 1:
- Select Chart 1 on the dashboard and go to the Layout panel
- Check the box for "Control visibility using value"
- Select the Show Chart 1 parameter
- 12. Set up DZV to control Chart 2:
- Select Chart 2 on the dashboard and go to the Layout panel
- Check the box for "Control visibility using value"
- Select the Show Chart 2 parameter
- 13. Set up DZV to control the Chart 1 Button:
- Select the Chart 1 Button button on the dashboard and go to the Layout panel
- Check the box for "Control visibility using value"
- Select the Show Chart 2 parameter. (We want to see the Chart 1 Button when Chart 2 is visible.)
- 14. Set up DZV to control the Chart 2 Button:
- Select the Chart 2 Button on the dashboard and go to the Layout panel
- Check the box for "Control visibility using value"
- Select the Show Chart 1 parameter. (We want to see the Chart 2 Button when Chart 1 is visible.)
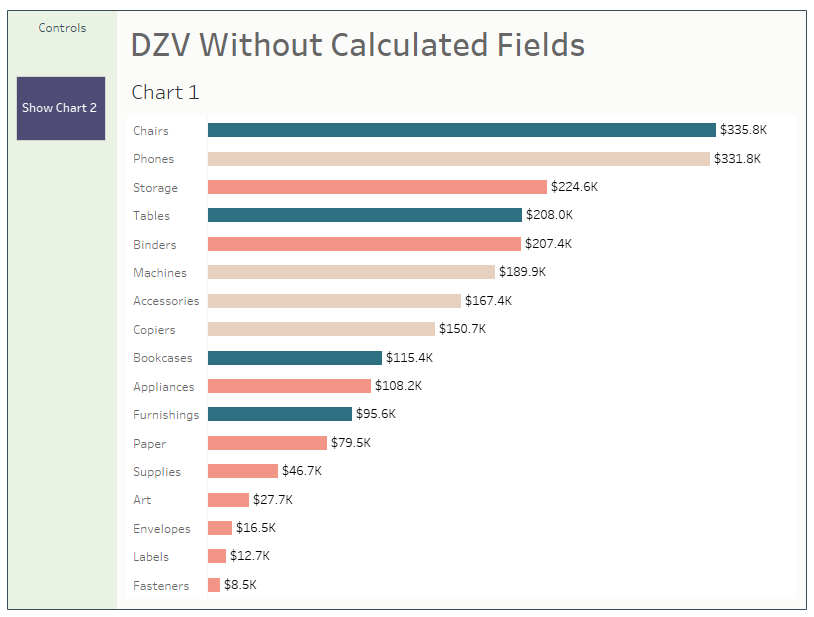
Voila! You've set up DZV without using calculated fields!
Check out and download my dashboard that uses this technique to swap between three charts. You can look at the parameters and dashboard actions to see how this method extends. For more than two charts, parameters are also needed to control the visibility of the buttons.