So this week’s MakeoverMonday challenge was Live from the 2016 London Tableau Conference. Unfortunately DS3 could not attend the conference but we all got to take part in the challenge simultaneously which was very exciting.
The topic for this week’s challenge was Women in the Corporate Workforce. The data consisted of the number of males and females at different level roles in US corporations for the years 2012 and 2015.
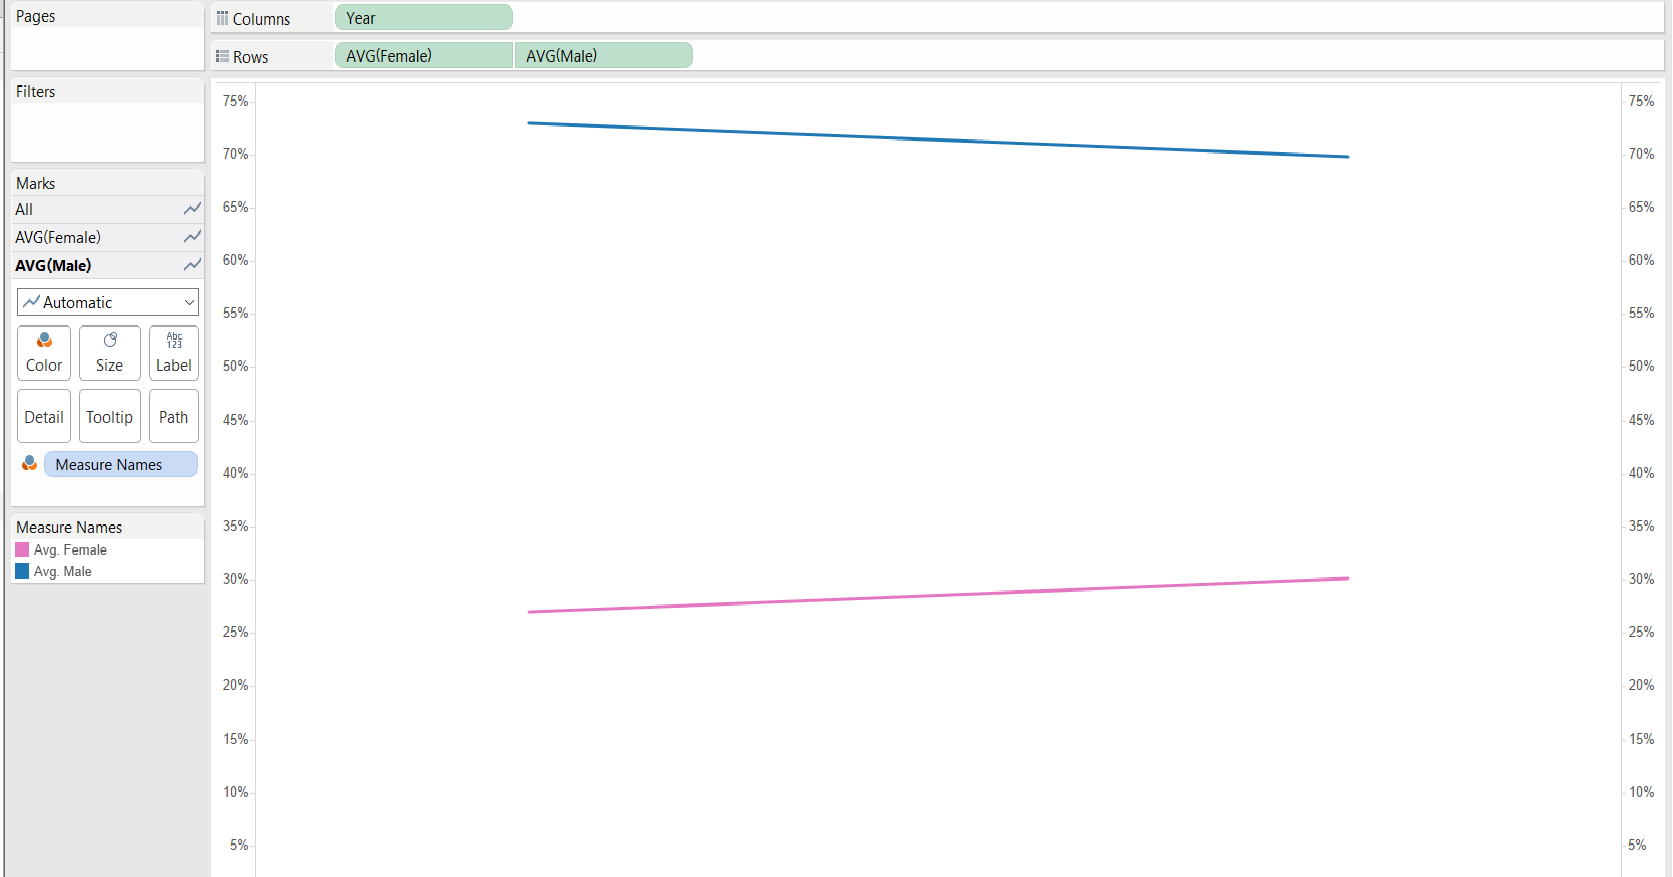
The first thought that came to my mind was to compare how both genders compare and straight away I could see the huge gap between number of males at corporate roles and the number of women. I thought then that it would be interesting to see how these numbers had progressed from 2012 until 2015. I dragged the Year field to the column shelf and then dragged the Male and Female fields to the Rows shelf and turn them into an average and I got a very simple timeline that showed that progression.
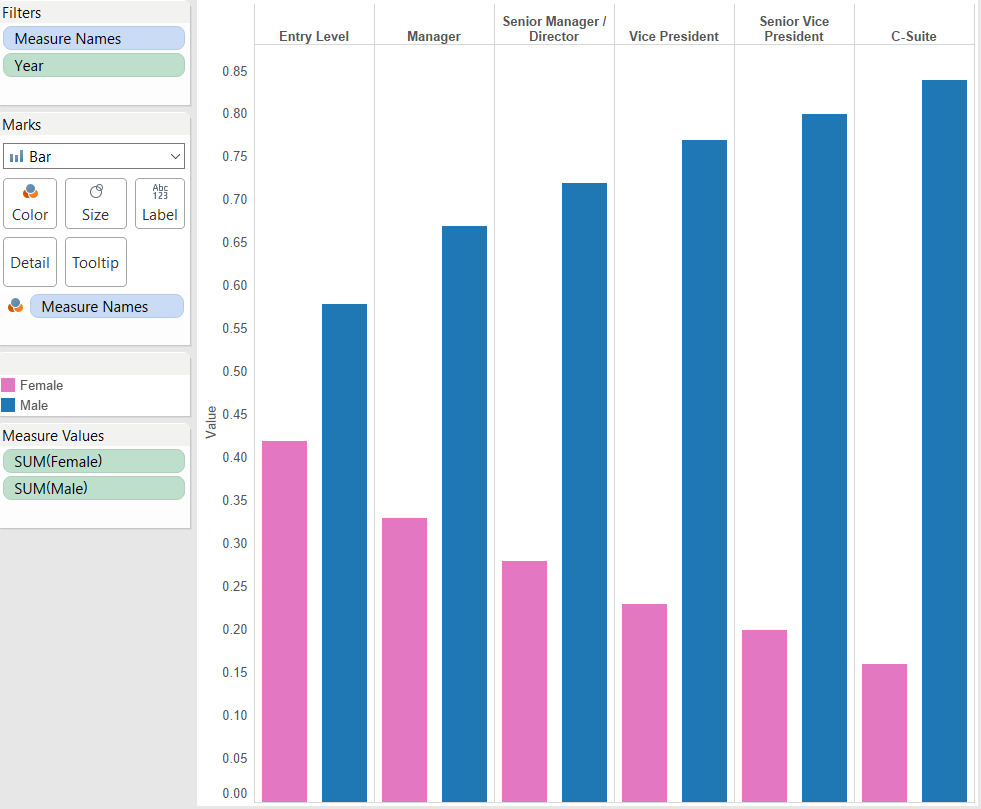
I was also interested in looking at how both genders compared looking at the different levels of the roles they performed along the corporate ladder. It was really interesting to see how despite a 3% increase in the number of women at corporate jobs from 2012 to 2015 their representation decreased as the roles were higher in the corporate ladder.
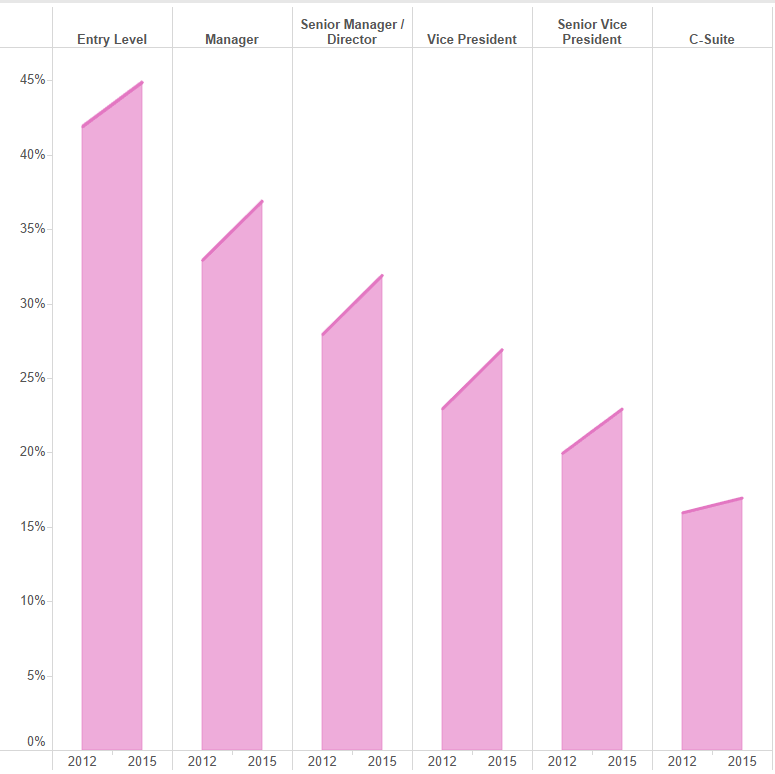
Finally I wanted to show how the number of women at the different levels of corporate roles had progressed since 2012.
This is the final result of this week’s MakeoverMonday challenge. The first one that I have actually done within the 1 hour limit 🙂
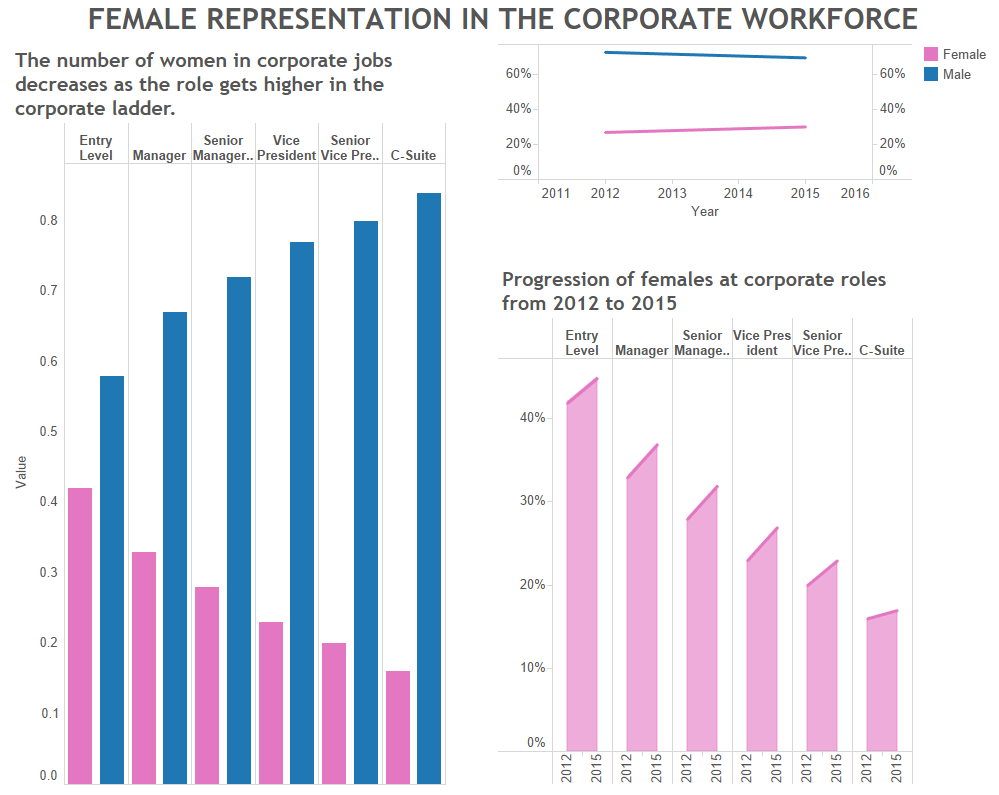
MakeoverMonday is a great way to practice your Tableau skills, it is also really good fun!!