I first came across context filters while looking at how to optimise the performance of my very first dashboard. I added some filters to context, didn’t immediately notice any difference in performance and then took them off again without a second thought. Unbeknownst to me at the time, like most of Tableau, there’s a little more to context filters than meets the untrained eye.
First, we’ll run through what context filters are and how they work, then we’ll go through a practical example to see what this functionality will look like in Tableau.
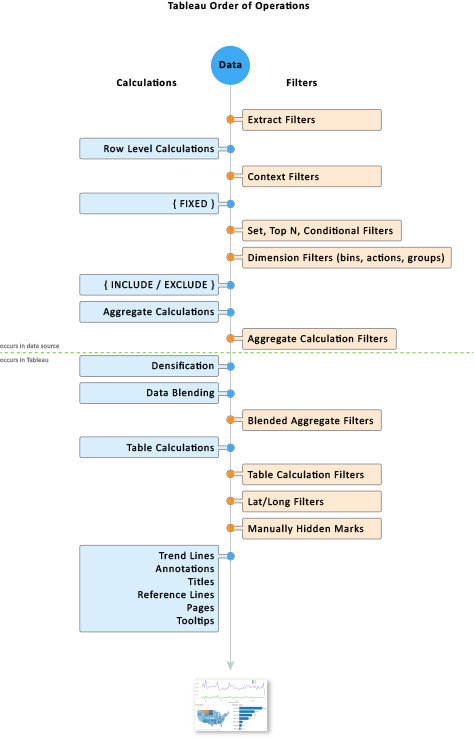
Context filters are very similar to regular filters in that they will slice up data any way you could possibly ask. Where they differ, is in where they sit in Tableau’s order of operations. Context filters are earlier in the order and this can change how things are calculated.
The order in which calculations are made can have a drastic impact on their result. For example, 2+3×4=14 because you must do the multiplication before you do the addition. But (2+3)x4=20. The brackets change the order that we complete the calculation and because of this we get a different result. The same concept applies to the example below.
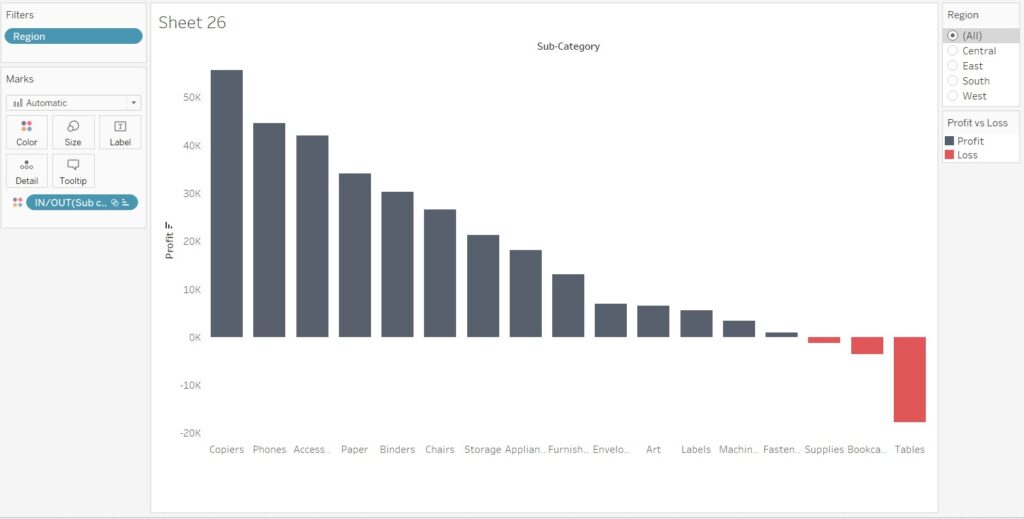
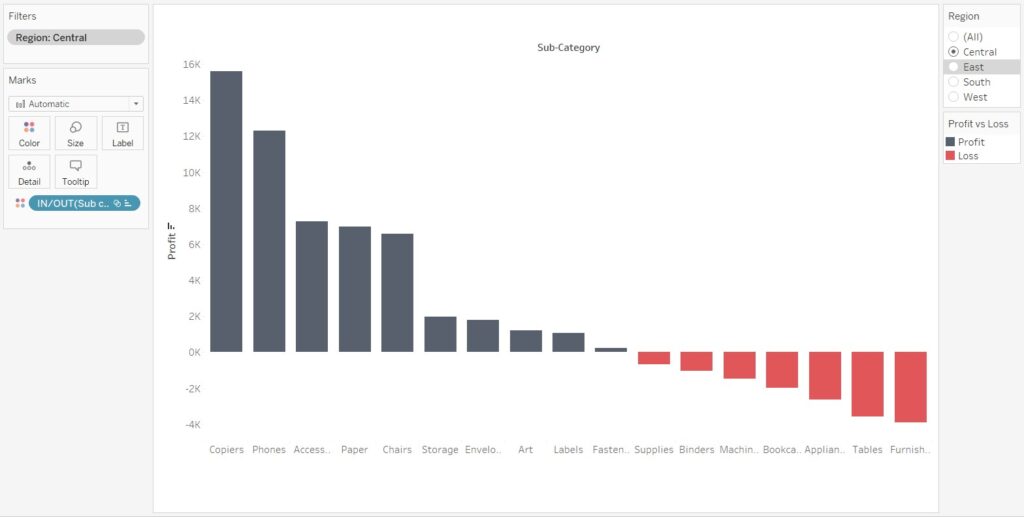
In this scenario we have profit, split into multiple sub categories. The colour mark is a set calculation looking at which sub categories are operating at less than zero, a loss (in red).
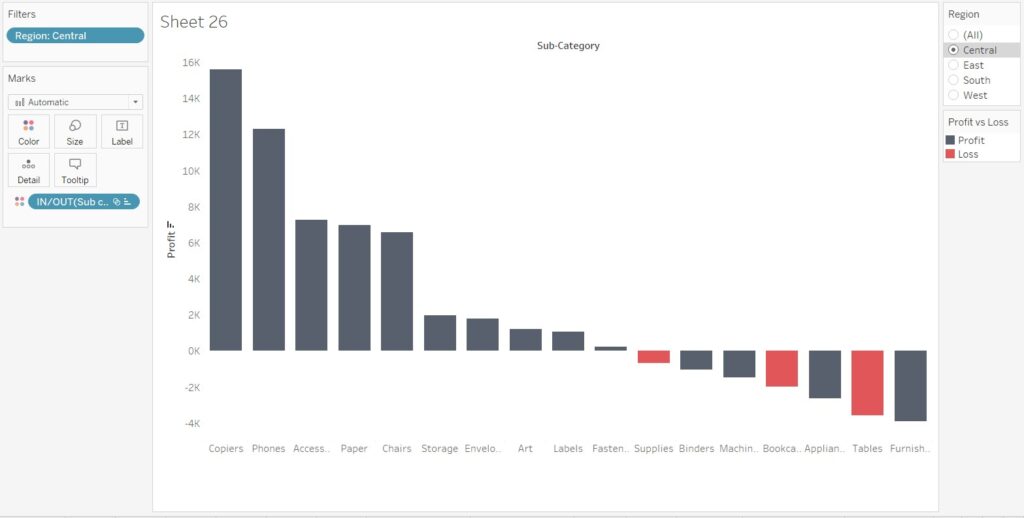
After filtering to the Central region only, we see that there are several more subcategories that are operating at a loss in this specific region. They are still black because the set calculation happens first. The set calculation decides which sub categories to make red and once completed the dimension filter slices our data to give us this view.
Set calculation: Which sub category is making a profit or loss? (Supplies, Bookcases and Tables become red) → Dimension filter: Which regions are we looking at? Since Tableau has decided what to colour each sub category first, the region filter won’t affect it because it is second.
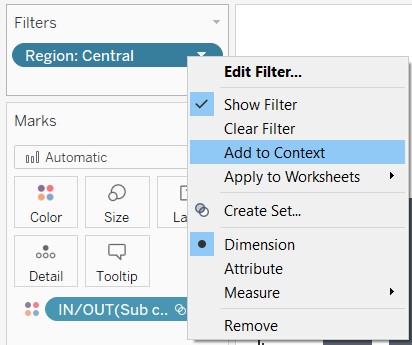
Right clicking on the region filter will bring up a menu where we can add the filter to context. Once we’ve done that the filter will change colour to reflect it becoming a context filter, and our bar chart will change accordingly.
Why is our profit/loss colour mark now only considering the Central region data in its calculation?
Now that Region is a context filter instead of a dimension filter, Tableau will filter for region first before it gets to our Set calculation. Take another look at the order of operations image if needed.
Our calculation order is now Context filter: Which regions are we looking at? (Focus in on the Central region slice of the dataset) → Set calculation: (In the Central region) Is each sub category making a profit or loss? Tableau now has to check which region we want it to calculate first before working out which sub categories are making a profit or loss.
Context filters are a little bit confusing because they make the most sense when you think about the order of operations, what Tableau does in the background behind the curtains. This is a bit antithetical to Tableau’s visual intuitiveness, where understanding of function tends to come from what is displayed in front of your eyes. While it is a confusing topic the order of operations is important is a plethora of Tableau’s functionality. Another example to help wrap your head around the order of operations can be found here. /brandon-fitz-gerald/filter-order-of-operations-for-tableau/
Context filters can be an easily overlooked weapon in Tableau’s impressive arsenal, but if you can understand how they work and why you’ll have another useful tool when tackling data.