Last week we were introduced to set actions, which allow users to drill down into the data to another level of granularity. In our example we learnt how to do this for different categories in the view for a bar graph. I wanted to see if you could apply the same methodology to a scatter plot (I have nicknamed this the ‘exploding bubble’ if anyone knows a more appropriate name, please let me know!). Without too much trouble, it seems like the idea was possible:
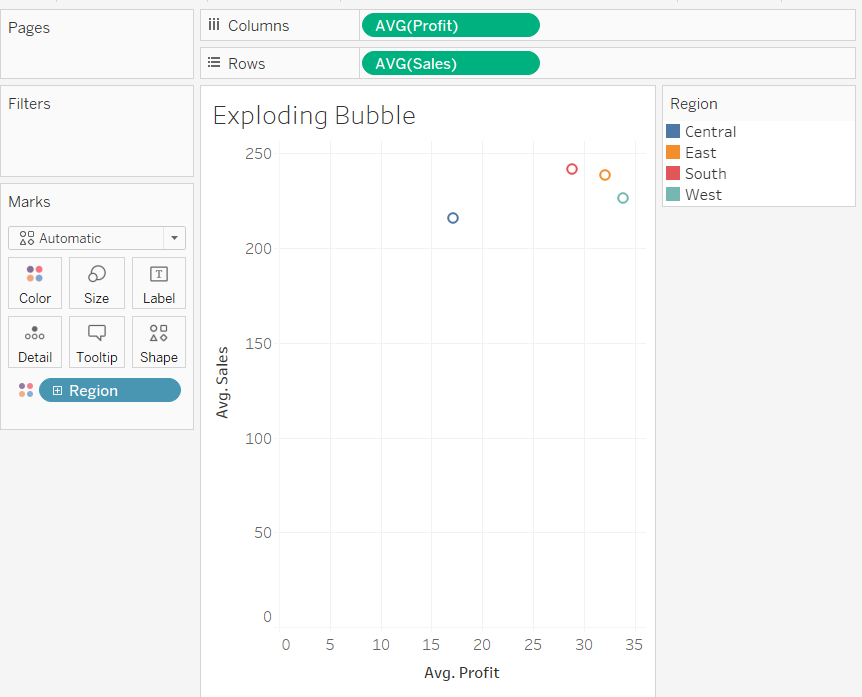
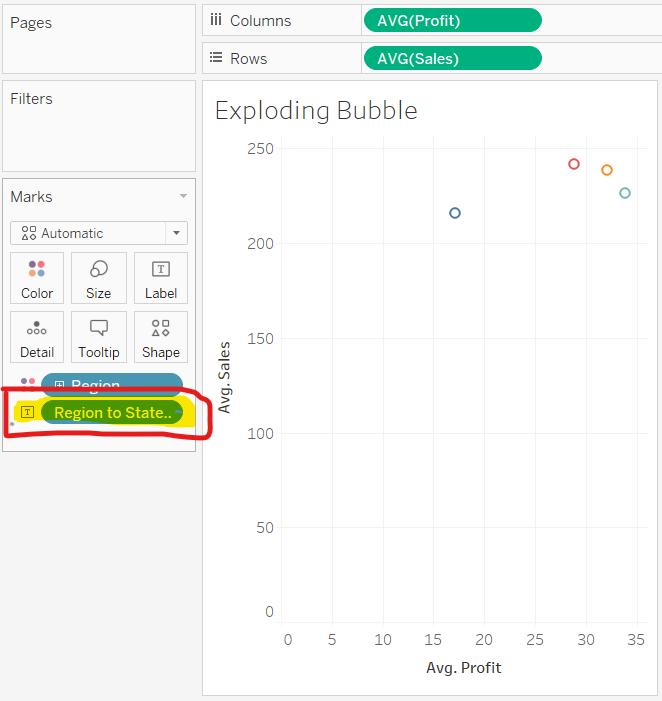
1. To create an ‘exploding bubble’ set action, first connect to Superstore data and create a scatter plot of average profit and average sales by region:
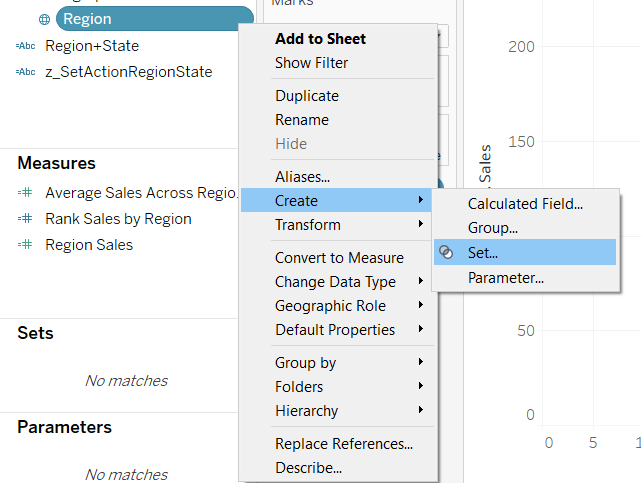
2. Create the Set for Region
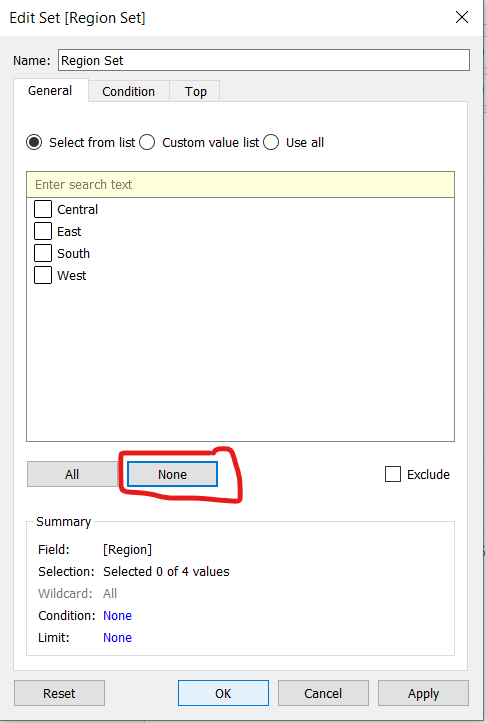
3. When creating the set, be sure to have no fields selected as below:
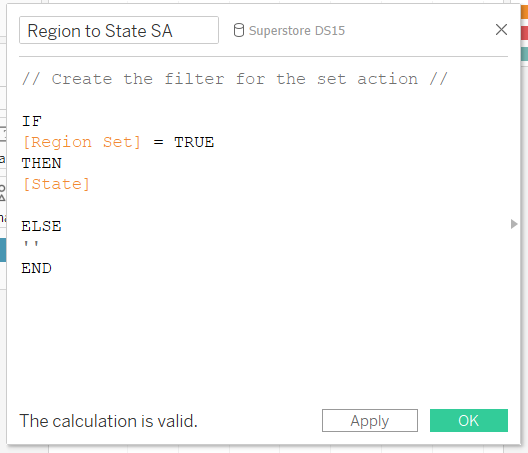
4. Create a calculated field for the view for the next level you wish to drill down to. Here we want to drill down from Region to State:
5. Add the calculated field to the view (I have chosen to add to Label so the States will label as the view changes).
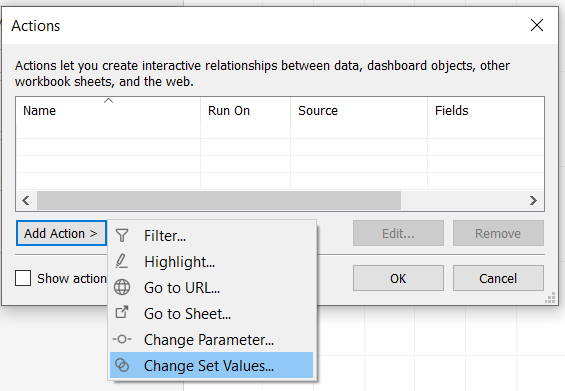
6. Create the Set Action: Worksheet > Actions.. (or press Ctrl+Shift+A). Select Change Set Values
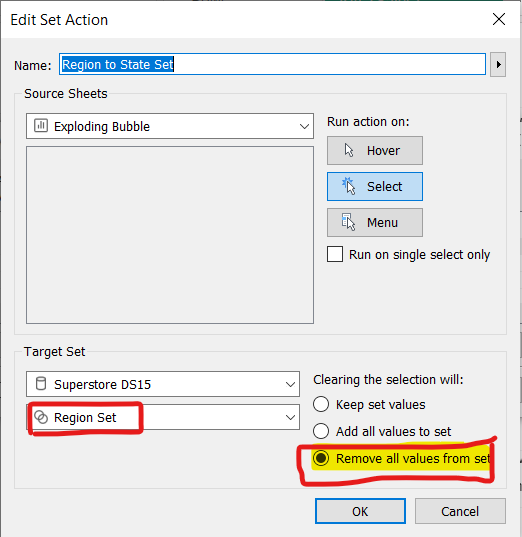
7. Be sure to select the Set that you created (e.g Region Set) and select Remove all values from set
7. Click on a bubble and watch it explode!