Dashboard Week Day 2
Today’s task was to choose a city event from the Diamond League Athletics website, download the PDF, clean the data in Alteryx and create a viz.
Downloading data from a PDF through Alteryx requires an R tool, which we needed to install some new packages into the R console. Thanks to a blog post by Ollie we had some step by step instructions to begin the process. Although, it managed to take us a long time to install the new packages as we installed new versions of R only to realise it was installed in the Alteryx program files where the packages had to be installed. Once we had overcome this we were ready to clean the data.
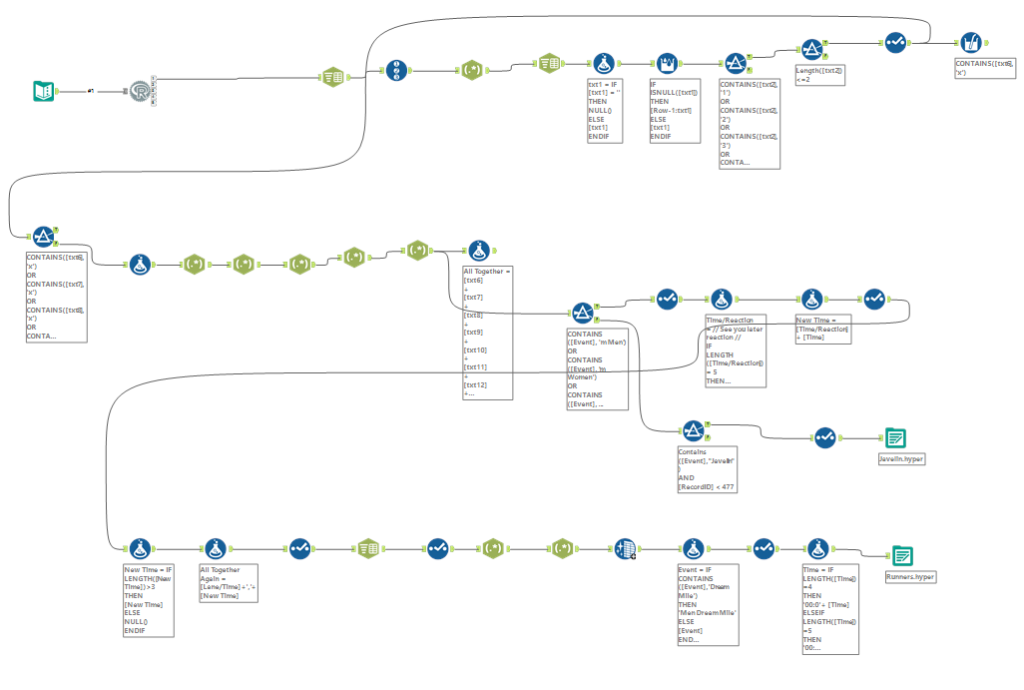
Similar to yesterday, regex was your best friend. The enemy here was the differences in the tables throughout the PDF. As the events varied from 100m to long jump, each table was structured quite differently. By lunch I was nowhere and decided it was best to start again fresh. This seemed the best idea and with a lot of frustration managed to pull the tables I wanted for running events and javelin. There were some tables I left out as time was ticking. The workflow I produced is below and could do with a lot of optimising!
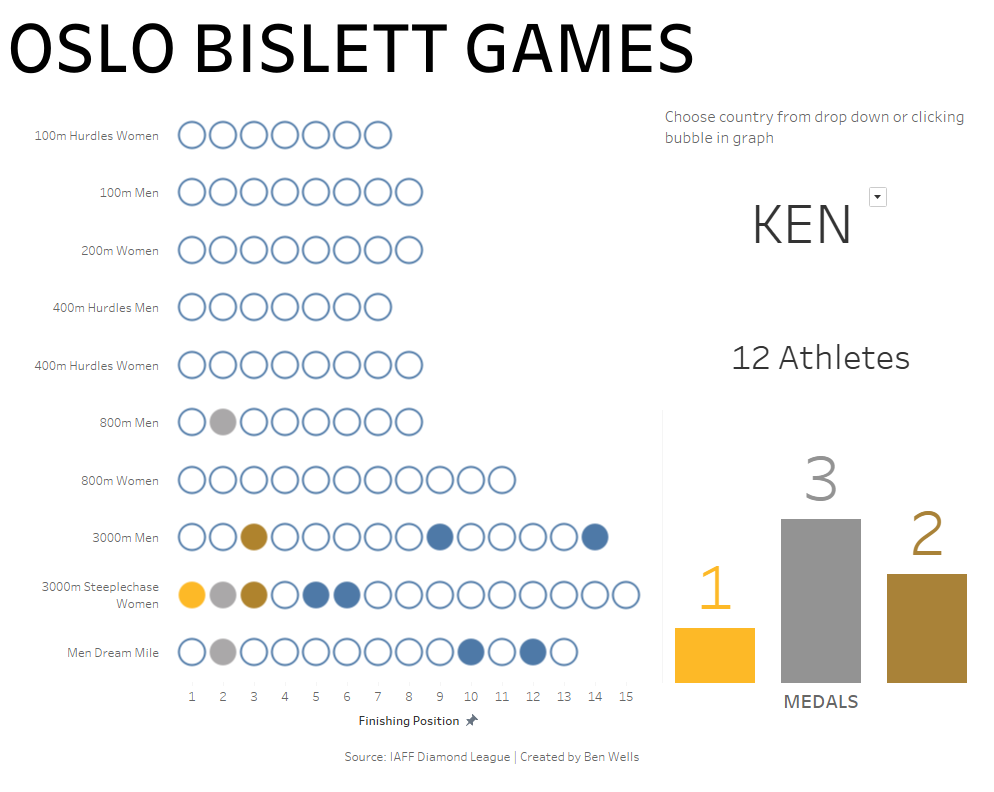
Now I had the data, I had a couple of hours to create a dashboard so the stress of the time was lifted compared to yesterday. However, the data set didn’t have too many variables to explore so I went with an overview of the running events I had cleaned. The viz allows the user to choose a country to see the positions of the athletes compared to the other competitors. Check it out below
Off shadowing tomorrow, so will be missing day #3…