Dashboard Week
MONDAY
Last week at the Data School, the intensity had definitely stepped up. Where we would normally create a viz every week, we were each creating and presenting one every day.
Each afternoon we are given a dataset and free reign to create whatever we like including adding in extra data (you do this at your peril when you consider the extra time limit!).
I have found over the last couple of weeks that I’ve started flexing my creative muscles a bit more and with more use, I feel they are really starting to come into their own.
Monday’s data was from the CPSCs Injury Surveillance System (a national probability sample of US hospitals, link: http://www.cpsc.gov/en/Research–Statistics/Injury-Statistics/).
After having a feel for the data by creating a few quick simple bar charts I found what was chosen initially as a fun dataset on wall-punchers and other silly injuries actually contained so much more that was certainly not as light-hearted. By far the age group most likely to be injured were children under 5, especially infants. The body part most likely to be injured was their head. Not so light-hearted anymore. This left me torn as to what I wanted to focus on within the dataset.
The data itself looked like this:
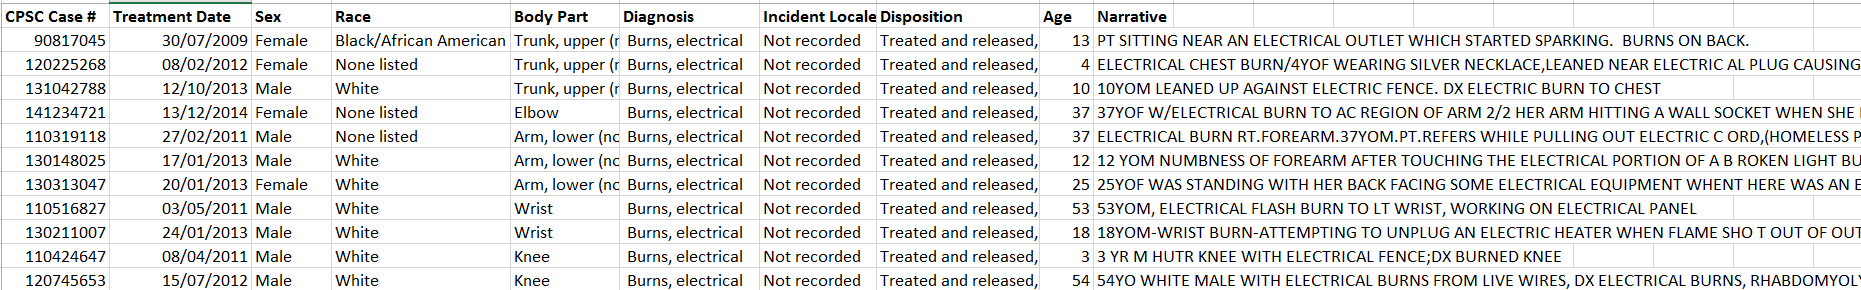
For me, the most interesting aspect of the data was immediately the rich text data under the column name ‘Narrative’ where presumably hospital staff type in a quick description of each hospital visit with quite a bit of detail. As a result, I made the narrative the main star of my viz by creating a search engine that can search for one or two specific words or phrases within the narrative. The results come up on a floating image that looks like a medical clipboard and the results can be further filtered based on sex, age range, disposition (whether they were treated, kept for observation etc) . The final results are then broken down visually and simply by sex, age, body part affected and diagnosis in some bar charts. These are arranged as if in a notebook. This way, it is entirely up to the viewer to decide what kind of injuries they are interested in, whether it be morbid or amusing.
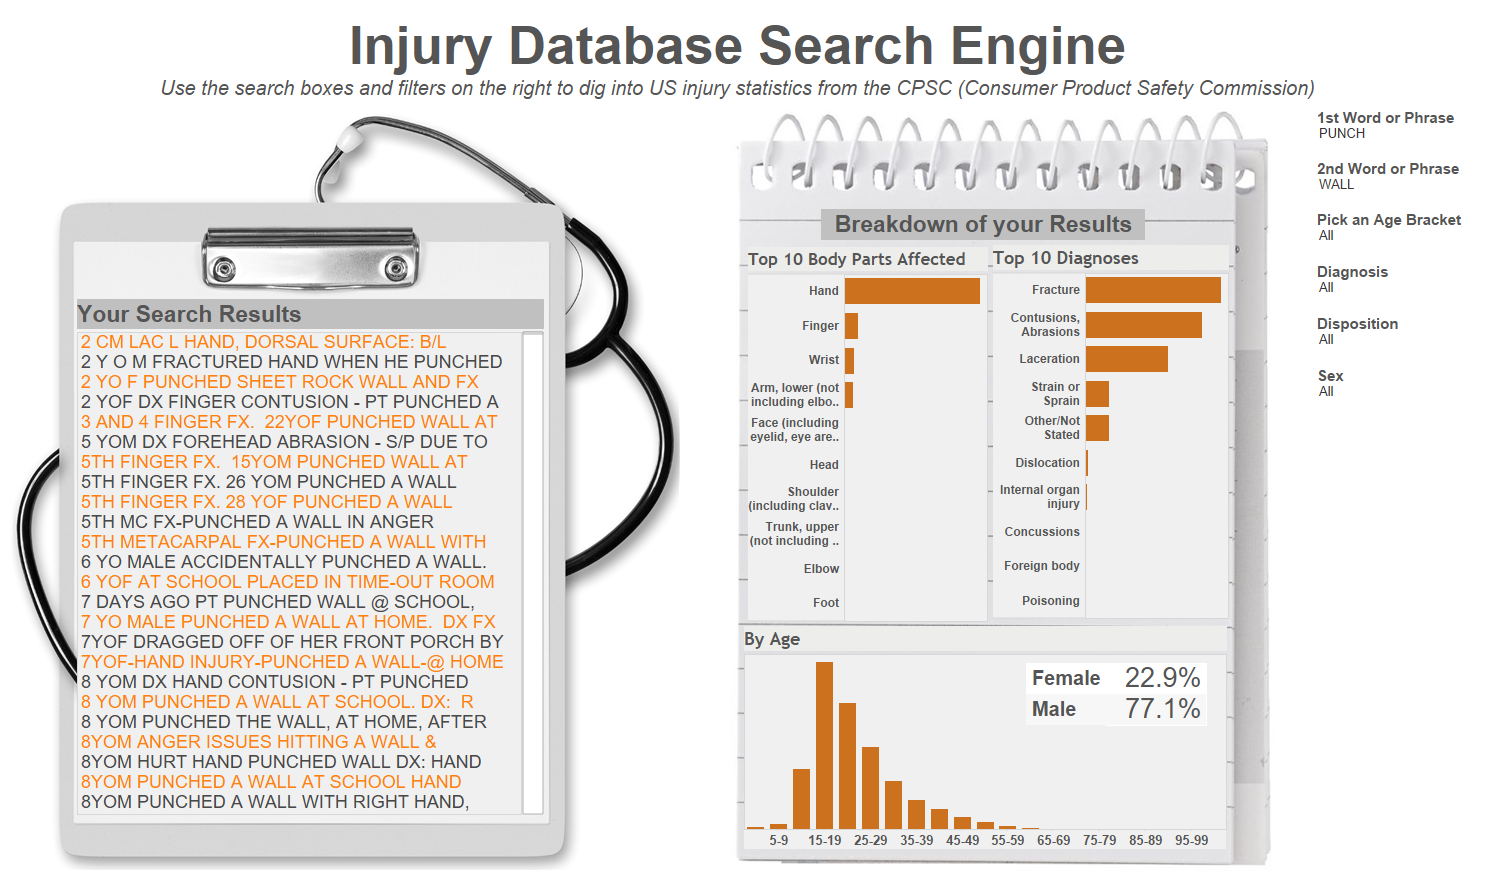
Overall I’m happy with this visualization, the only issue is that doing a search takes quite a long time as Tableau is doing a long laborious text search of every single word in the Narrative column and though it’s using a Tableau extract, this hasn’t sped the search up by much. I also removed any unnecessary fields in Alteryx beforehand so apart from that.
If you have some ideas to increase the load speed then please do put it in the comments!
Anuka