In this post I discuss how to tackle frequent issues that come up when creating dynamic tooltips: how to concatenate different data types, mix aggregate and non-aggregate fields in IF statements, and use level of detail expressions.
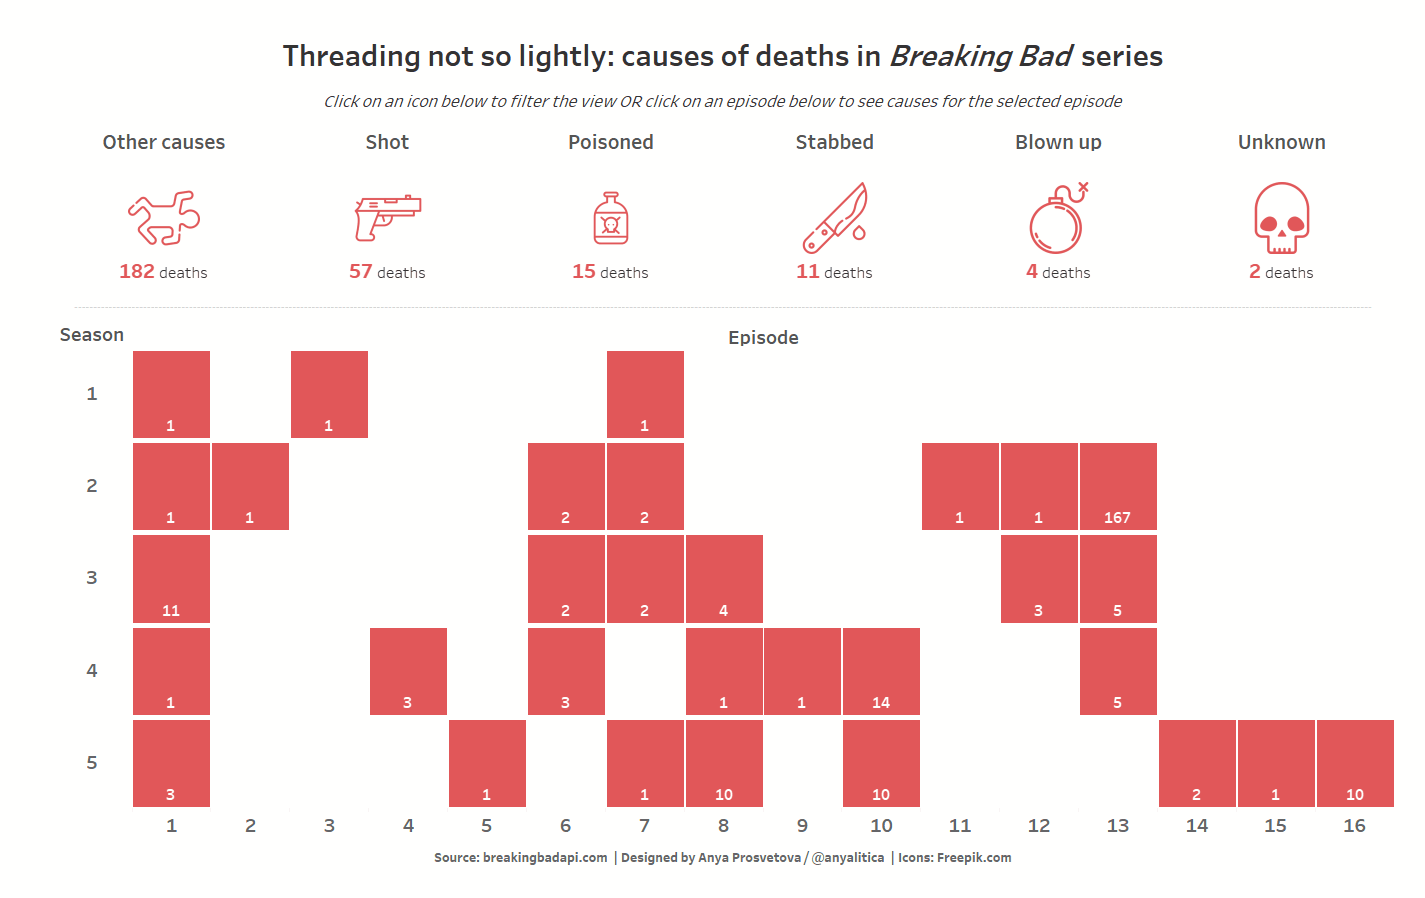
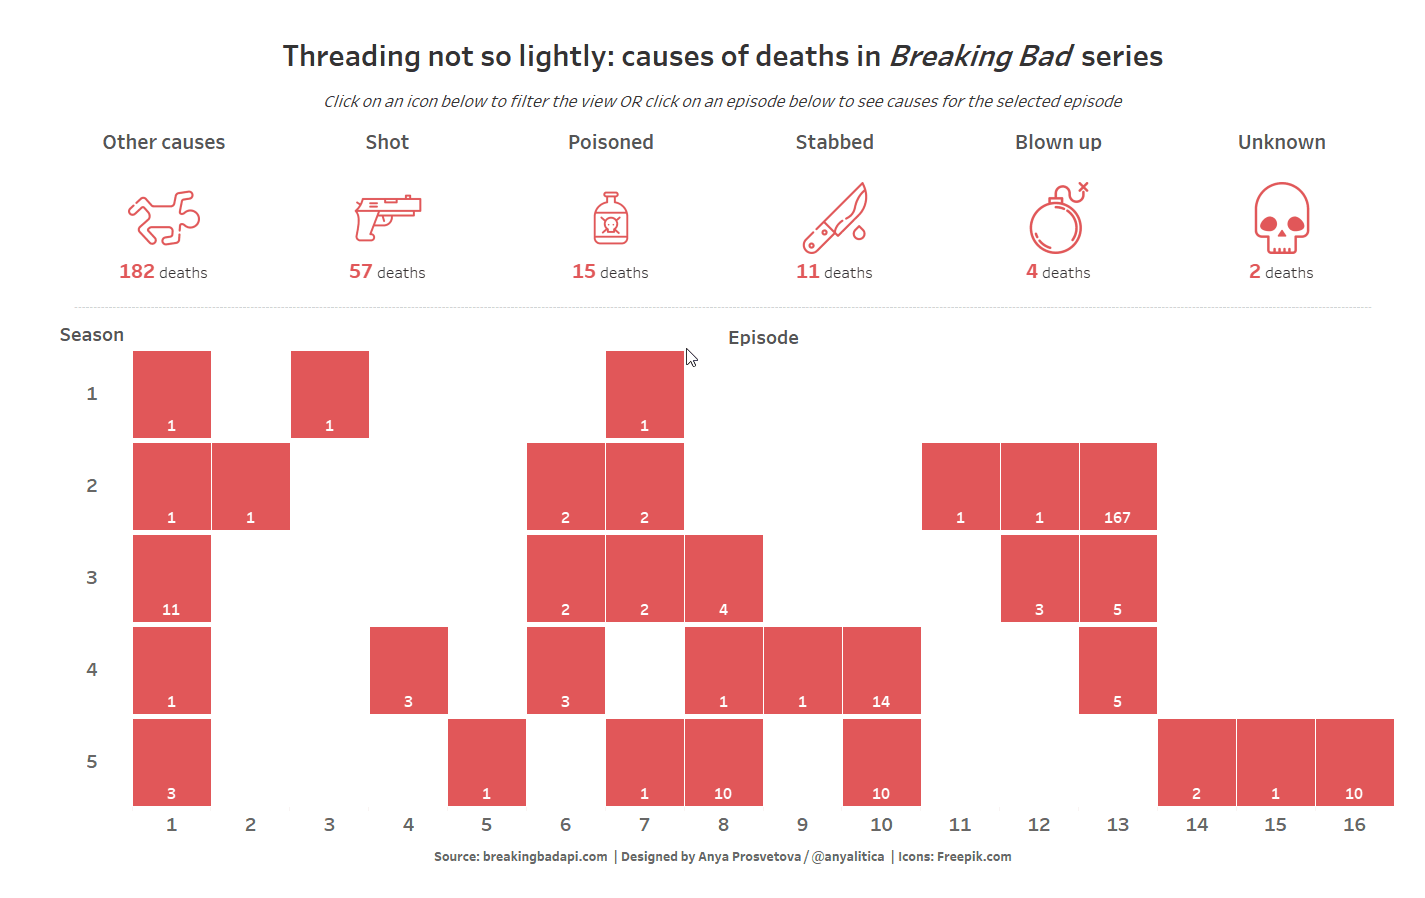
Last Friday we joined DS16 for their Dashboard Week challenge and worked with the Breaking Bad API compiled by Tim Biles. We had only 3 hours to create a dashboard, and since I haven’t watched the show before I decided to look at an angle which doesn’t require a lot of background knowledge – causes of characters’ deaths in the series.
For my dashboard, I wanted to make sure that tooltips are showing the correct information about the total number of deaths in each episode and season. It wasn’t as easy as I expected, but I learned some new tricks along the way.
Combining different data types in tooltips
I wanted to make my tooltips dynamic to show the total number of deaths in each episode, for example:
There was 1 death in episode Y, season Z. (if there was only one death in a given episode)
OR
There were X deaths in episode Y, season Z. (if there were multiple deaths in a given episode.
1 – First, I found the parts of the tooltips’ text that would change depending on the number. They are highlighted in bold below:
There was 1 death in episode Y, season Z.
OR
There were X deaths in episode Y, season Z.
2 – Next, I wrote a calculated field to conditionally change the text. I named it Dynamic tooltip text:
IF SUM([Number of Deaths]) = 1 THEN “There was 1 death in episode ” + ATTR([Episode]) + “, season ” + ATTR([Season]) +”.”
ELSEIF SUM([Number of Deaths]) > 1 THEN “There were ” + STR(SUM([Number of Deaths])) + ” deaths in episode ” + ATTR([Episode]) + “, season ” + ATTR([Season]) +”.”
ELSE ” “
END
There are several points to consider in this field:
1 – When IF expression contains at least one aggregated field (in this case SUM([Number of Deaths])), then all fields in the calculation must be aggregates as well. Otherwise, you will get an error message: “Cannot mix aggregate and non-aggregate comparisons or results in ‘IF’ expressions”. I got this error the first time when I wrote my formula as below:
IF SUM([Number of Deaths]) = 1 THEN “There was 1 death in episode ” + [Episode] + “, season ” + [Season] +”.”
ELSEIF SUM([Number of Deaths]) > 1 THEN “There were ” + STR(SUM([Number of Deaths])) + ” deaths in episode ” + [Episode] + “, season ” + [Season] +”.”
ELSE ” “
END
Notice the difference? In my first attempt at writing the calculation, the fields [Episode] and [Season] don’t have the Attribute (ATTR) function applied to them as in the final calculation. [Episode] and [Season] in this case are dimensions of data type string, so Tableau sees them as non-aggregate compared to the aggregated SUM([Number of Deaths]).
You can solve this issue in the calculation by applying the ATTR() function, thereby turning a non-aggregate value into an aggregate one. Let’s have another look at the version that does work:
IF SUM([Number of Deaths]) = 1 THEN “There was 1 death in episode ” + ATTR([Episode]) + “, season ” + ATTR([Season]) +”.”
ELSEIF SUM([Number of Deaths]) > 1 THEN “There were ” + STR(SUM([Number of Deaths])) + ” deaths in episode ” + ATTR([Episode]) + “, season ” + ATTR([Season]) +”.”
ELSE ” “
END
2 – Remember that this calculation is intended to create a text string to be displayed in the tooltips. So, to display a numeric value in this text string, its data type should be changed from number (whole or decimal, depending on your data) to string. To do so, just wrap your measure field with the STR() function, which returns a string from the numerical values you give it. Now that we have converted all the fields to the string data type, Tableau will be able to concatenate all parts of the sentence. See how it works in the calculation below:
IF SUM([Number of Deaths]) = 1 THEN “There was 1 death in episode ” + ATTR([Episode]) + “, season ” + ATTR([Season]) +”.”
ELSEIF SUM([Number of Deaths]) > 1 THEN “There were ” + STR(SUM([Number of Deaths])) + ” deaths in episode ” + ATTR([Episode]) + “, season ” + ATTR([Season]) +”.”
ELSE ” “
END
Using Level of Detail (LOD) expression to show the correct total in tooltips
The main part of my dashboard was created as a bar chart, where all the bars were made the same size using the Percent of Total table calculation. You can read more about why I chose this type of chart and how I made it in this blog post. I also applied the proportional brushing technique using set actions to highlight the episodes where characters’ deaths had similar causes.
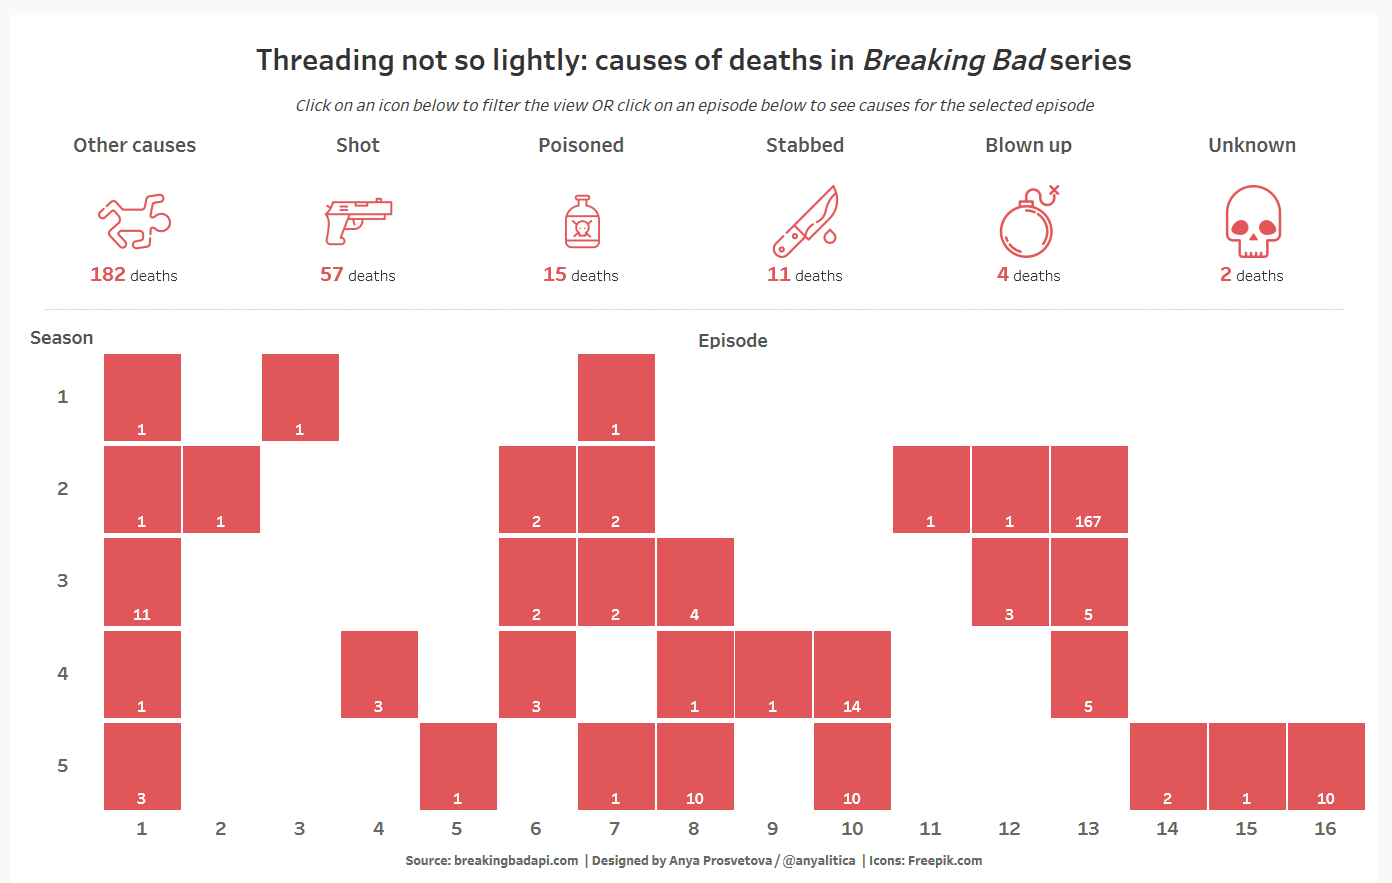
Once I created the set action, I faced my next tooltip challenge. After the set action was applied, when a user selects a cause of death, the tooltips would show the number of deaths per cause of death (represented by the segment of the bar chart) rather than the total number of deaths per episode.
As my previously created calculation showed different text depending on whether a bar chart displayed one or multiple deaths, this formatting trick didn’t work in a situation when a bar for an episode had two segments: one segment equaling 1 and the other 1 or higher. The calculation just looked at the number of deaths per highlighted segment of the bar chart rather than the total for this chart.
To fix this, I turned to the FIXED LOD expression to ensure that my tooltips display the total number of deaths per episode, ignoring the breakdown by cause of death produced by the set action. As I needed to fix the total number of deaths per episode and season, I created a new calculated field called Total deaths for tooltip with the following formula (a shout out to Jamie Bassett and Charlie Scammell from DS16 for helping me tackle this issue!):
{FIXED [Episode],[Season]: SUM([Number of Deaths])}
Now we can use this calculation in the previously created calculated field Dynamic tooltip text as shown below:
IF SUM([Total deaths for tooltip]) = 1 THEN “There was ” + STR(SUM([Total deaths for tooltip])) + ” death in episode ” + ATTR([Episode]) + “, season ” + ATTR([Season]) +”.”
ELSEIF SUM([Total deaths for tooltip]) > 1 THEN “There were ” + STR(SUM([Total deaths for tooltip])) + ” deaths in episode ” + ATTR([Episode]) + “, season ” + ATTR([Season]) +”.”
ELSE ” “
END
This is how you can make dynamic tooltips in your vizzes. I hope you find these tips helpful. Feel free to ask questions and explore the final dashboard on my Tableau Public profile.