Day #3 into our Dashboard week and today’s task was to visualise UNESCO World Heritage sites. The day started by reading Andy’s blog, which also featured a very cool photo of Stonehenge that he has taken. Motivating and inspiring, right?
“How difficult or complicate can the data set be? It’s Heritage sites for God’s sake. The data should be pretty straight forward and quite easy to analyse and interpret. Today I’m gonna learn some new stuff about the world by using Tableau!” That’s what I thought… Oh wait, did I say Tableau? Make this Power BI. And to get our data, we had to scrape the list of countries from Wikipedia along with the information about the sites within each country from their respective links.
Fantastic! I had no idea how to web scrape and I also had no idea how to use Power BI. So that means another day in the Data School full of learning and implementing new stuff!
I started by looking at html of the Wikipedia page. Shortly afterwards, I noticed that for the table containing all the information, each cell started with “<td>”, followed by the value of that cell and then a closing statement “<\td>”. Also the name of the headers started with “<th”. Filtering those values was easy, cleansing them is another thing.
It wasn’t until 1 pm that I have finished web scraping the data for the first table and then I had to do the same for each sub-table within the data. Obviously, I didn’t have the time to do that and just by watching the people around me clearly that wasn’t the best idea. By staring at my data in despair, I noticed that China had the most number of UNESCO sites; Oh wait a minute! Greece is in the list as well. But Greece is much much smaller in surface area than China. Maybe I should add a twist to the plot and explore which country has the most Heritage sites by surface area.
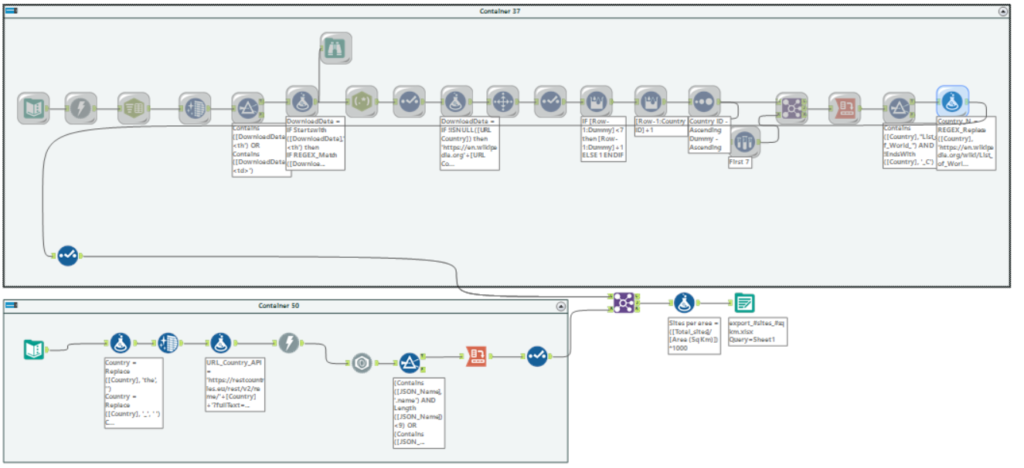
And this is what I did. I found an API returning values for each country and got information only for the surface area. Then I combined my data back to my main flow and loaded the data in Power BI. Basic dashboard, here I come! 🙂
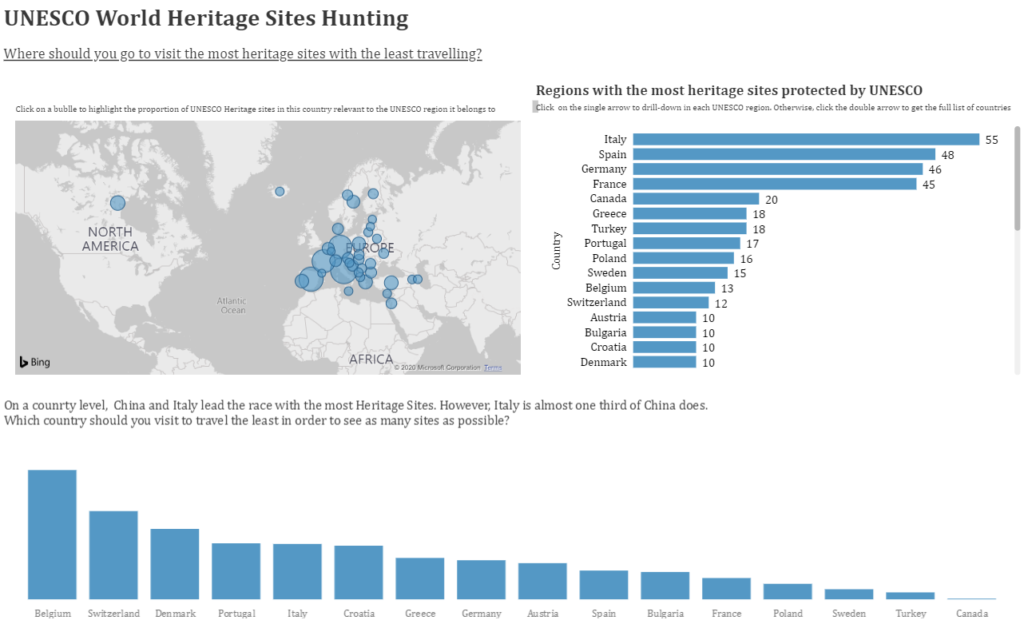
Map on the top left always works and clicking on the bubble automatically proportionally brushes the bar chart on the right. And it does that without you having to define a set action. Power BI, you are smart and easy to use, but still I felt kind of restricted compared to when I’m using Tableau. Day 3 done, off to day 4!