The first day's challenge was to create a dashboard about LEGO pieces based on a database of eight sheets, to be accessed and connected in SQL (Snowflake). I began by sketching a possible data model to connect the eight tables, shown below. The tables seemed to be split into two groups: three referring to the content of some LEGO inventories, and five with general information about the pieces, such as the colour and set theme.
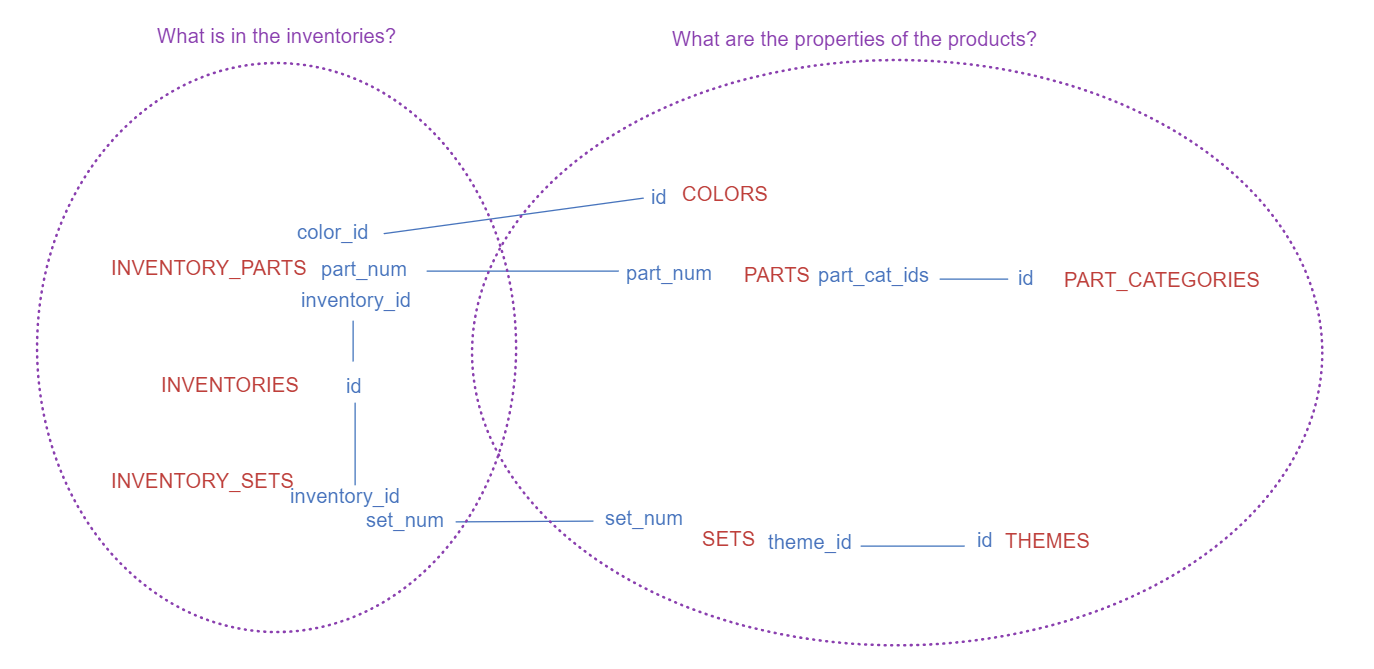
I attempted to connect all these together in SQL, building up from the inventory_parts table, which contained 580,000 rows on different LEGO items in the inventory. Very few of the inventory_ids in this table were present in the inventory_sets table, meaning their connection either led to a drop to just 432 rows (inner join) or the vast majority of rows having null set data (left join).
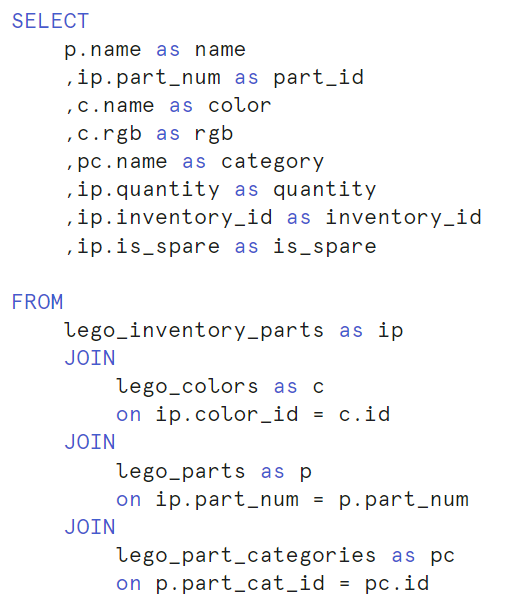
With this issue in mind, I narrowed my focus to the upper half of of my data model, and connected inventory_parts, colors, parts and part_categories. These were all connected using inner joins and ID fields, and only required very simple SQL code, shown below.
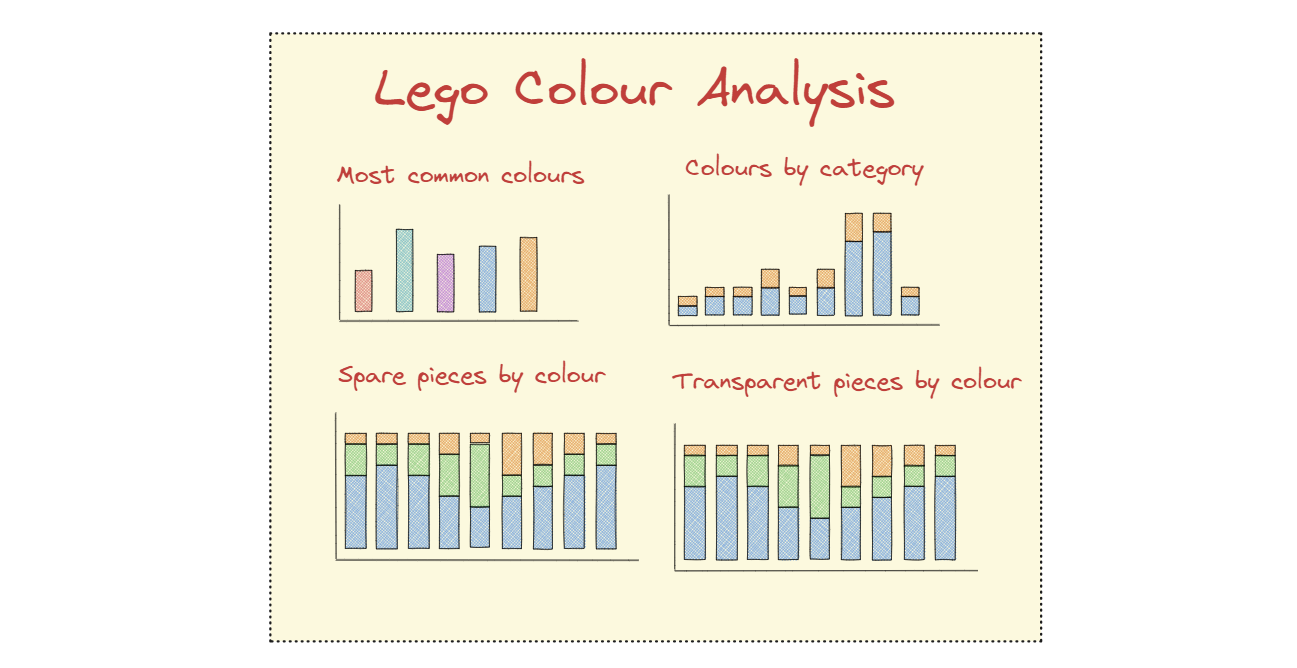
With this data, I decided to focus on colour: What are the most common colours? How do they vary by category? Are some colours more likely to be spare? I made a very basic mockup:
The data contained RGB Hex Codes. Power BI can perform conditional formatting with Hex Codes, although these need initial # symbols, so these were added in Power Query as a prefix. This conditional formatting allowed me to make the bars in the bar charts match the colour they are representing data for, although Power BI does not allow conditional colour formatting when a legend is added, which limited some of the charts I could create.
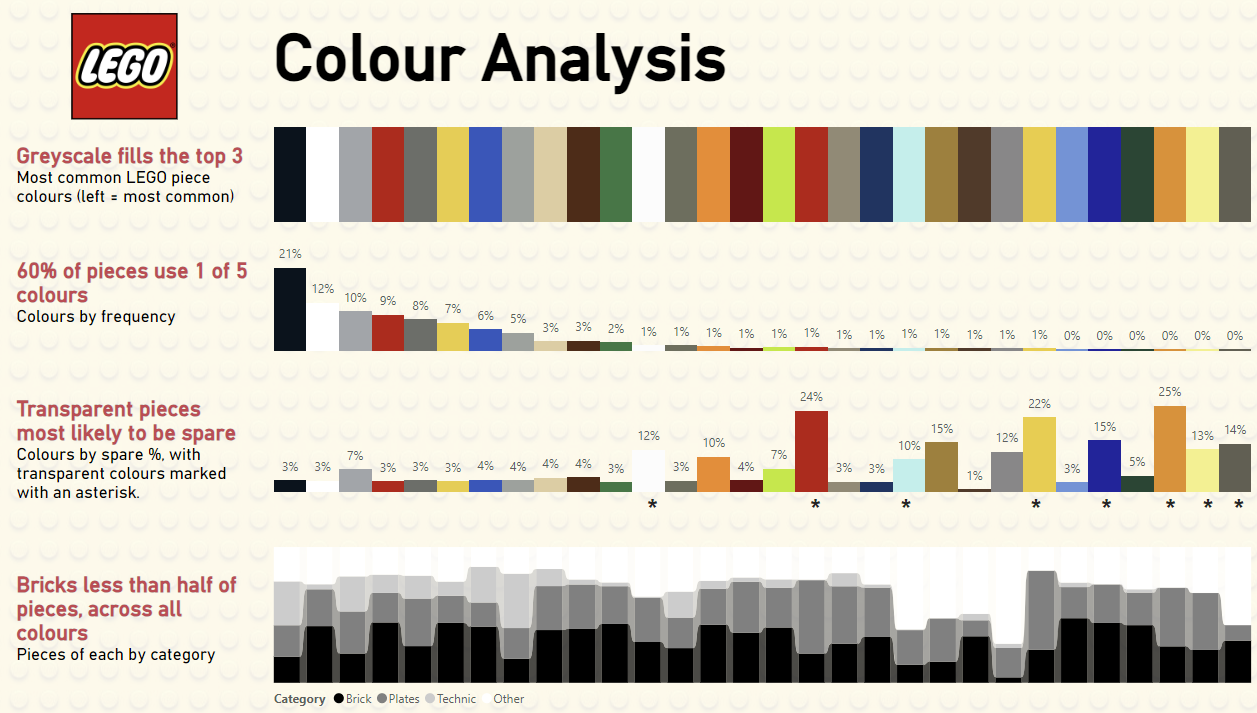
The final product is presented below. A light LEGO-patterned background was added to allow the white colour bars to be visible.