Here at the Data school we are habitual Tableau users; hardly a day goes by, including weekends, without opening Tableau at least once, even if only to make a minor tweak or two.
I’ve been here close to 3 months now, and last week ran a brief intro to Tableau training session for members of the public new to Tableau. Quite a few of them had been or were using Power BI in their work, and had questions for me asking how Tableau differs from Microsoft’s visual analytics product. I hadn’t used the product at the time, but today we had a play around with Power BI as part of dashboard week (a week during which Andy Kriebel gives us a new data set to dashboard every day along with a new challenge).
Here is a small collection of my thoughts on the product.
If you know what kind of chart types you want to make and the layout you want them to be in, then the product is quick to use and fairly easy to configure once you get to grips with where all the options are.
The default chart types are those most often used and are decent enough for simple reporting; however, a journey into the custom tools gallery leads to some new, more exciting tools and a lot of error messages telling me I don’t have R installed and that I need it.
The fact that all charts filter all the others by default is nice, making it really easy to see the makeup of your selected value/category elsewhere.
Location data is a bit of a struggle. I had a list of cities in the US, but plotting those simply on a map resulted in Athens beings placed in Europe, rather than in Georgia. The data contained states as well, these were plotted with no issue. Given this, I tried to create a hierarchy for state and then city, but this didn’t solve any of my problems.
We finally discovered that you have to go to the edit queries page, created a merged field of city <comma> state and then plot this on a map. However, be careful to drag this newly created field into the location section, as it defaults to legend, which is useless for what we want.
I really like the ability to right click on a line chart with time along the x axis (it might work for other hierarchical data, but I din’t explore it any further today) and to be given the option to expand all data points, meaning it is very easy to increase or decrease the granularity of whats in the view. The ability to also drill down through this same menu is useful, however it can be a bit confusing once you’ve drilled down to remember how far to drill up or to un-expand the extra detail you’ve put in the view.
When creating a big number to display total sales for example, this is easily done, and filters nicely if you click on a part of another chart. You are given the option to display the total sales as a percent of total, which is 100% by default, this doesn’t filter when clicking on another chart, and always remains as 100% – which is frustrating. It requires some advanced calculations to get the number to work as a real percent of grand total.
The sizing of the dashboard is hard to judge when creating it in the desktop app, and ends up being different to how it looks once published to the Power BI gallery. Under the view tab, there is the option to view the page in actual size, but this makes it larger than the view of the app can accommodate, which seems to mean that you are never able to fill every inch of your dashboard and easy see each bit all at once.
The card/charts created are in rectangular containers which can be resized by clicking and dragging the edges, and they fit together against one another with a satisfying visual clink. There are helpful red dotted lines to aid with alignment when resizing.
There are some really cool chart types in the custom visuals that would be incredibly difficult to create in Tableau, but they come with the limitation of being very difficult to modify, if at all. With some you are unable to even change the colour.
On the topic of formatting, it becomes a huge pain to format everything once you have your layout. There is no easy way that I could find to size all of the charts the same size. I guess if you know the size of the who dashboard you can divide that by the number of charts you want to display and then size them all manually that way…? In Tableau you can create containers which you can use to evenly size all the sheets within them, which makes sizing in dashboards a breeze, this would be a great feature for Power BI.
There’s no immediately easy way to change the content of tooltips. There does appear to be the option to create a page and to put that in the tooltip, but it would be nice to be able to edit to content of tooltips.
When you create a big number, it puts a category label underneath it by default which is great, big numbers should always have a little description of what they refer to beneath them… but you can’t edit them. They come up with accurate but wordy descriptions of the calculations, like ‘count of foreign gift amount’, which I would like to be able to pare down to ‘number of donations’. Instead I have had to add a title which I am able to edit, but this appears above the number, which isn’t what people are used to seeing in a KPI dashboard.
In summary, today has made me realise why Tableau is so powerful as an analytical tool – it is playful. You can drag and drop and change and build and create things in Tableau; in Power BI you pick a chart type and you display your data – it’s a reporting tool and nothing more. Tableau is a place to explore your data, all the way down to the most granular level, to make your discoveries and then to create simple, concise charts to convey those insights.
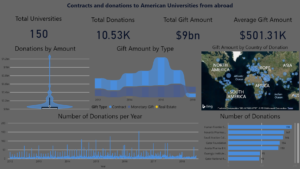
Why not take a look at what I created in the morning below and click on the image to be taken to the interactive version.