Dashboard Week: Day 1
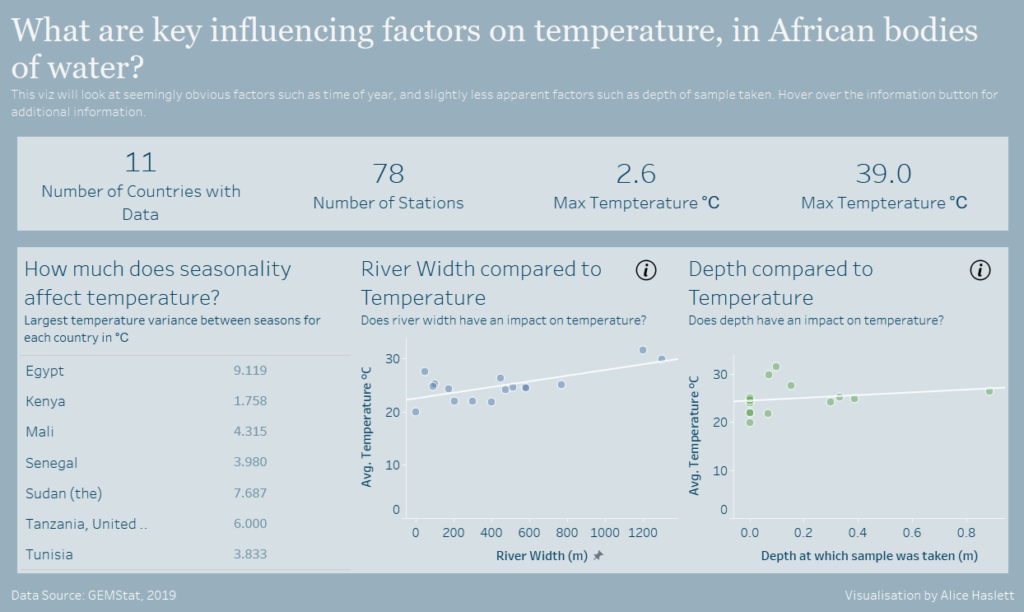
Today we have had our first taste of dashboard week, with data from GEMStat that looked at water quality. My area of focus was influencing factors on the temperature of water bodies in Africa.
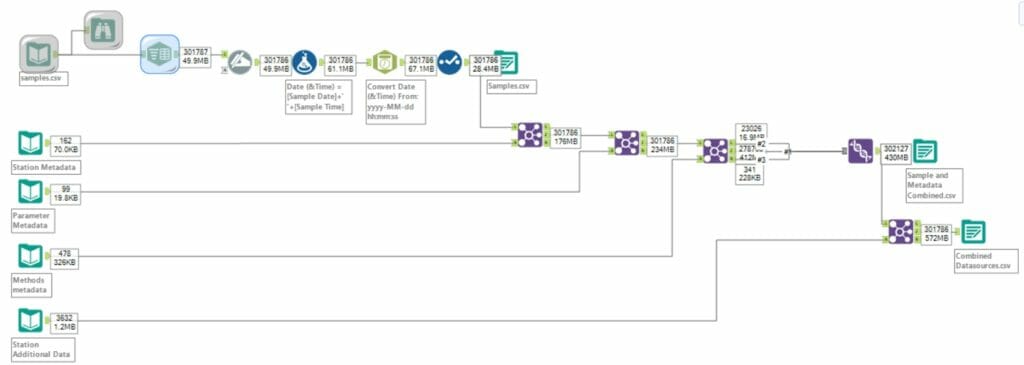
We had to request specific data, which was then emailed to us. We received the data in a folder with 3 documents; samples, key data information, and metadata (an excel with sheets containing information on stations, parameters, and method of collection). I combined the data on the samples and the metadata using Alteryx. There were a few limitations that I came across, missing data was the main one. There was not data for each country, and for each country there was not data for each year or each different metric. This posed a challenge for analysis. In an attempt to work around this issue I found geographic data on each station within Africa so that I could still do a geographic comparison within the countries instead of within the continent.
From this I decided to look at the impact on seasons, river width, and depth of sample taken on temperature.