


Tableau is good at analysing, it is so good that it can analyse itself. Technically it can analyse the Tableau server you have with your company/ organisations. Basically every Tableau server has stored its data in a server repository. You can access it to have an analysis on the server, its usage, activities. Basically everything Tableau server related.
For the documentation you can visit the GitHub hosted by Tableau here. The link contains the documentation of every views, tables and the description of the fields they contain.
So today in the training session we are asked to do a bit of an analysis on our own server. I chose "comments" as my topic to look at. If you want to know more about comments in Tableau server you can refer to this link.
First of all how do we connect to the server?
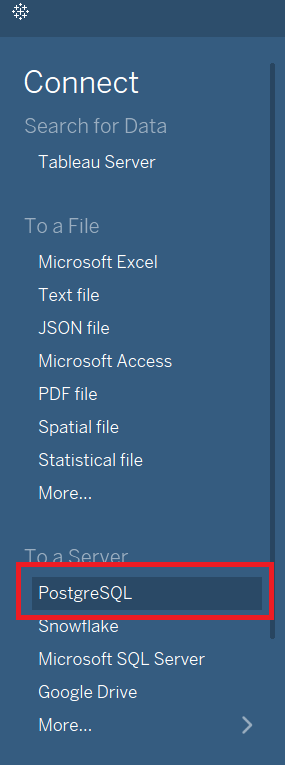
Open Tableau and choose to connect "To a Server" and choose "PostgreSQL". It applies to every Tableau server as it is where they store their server data.
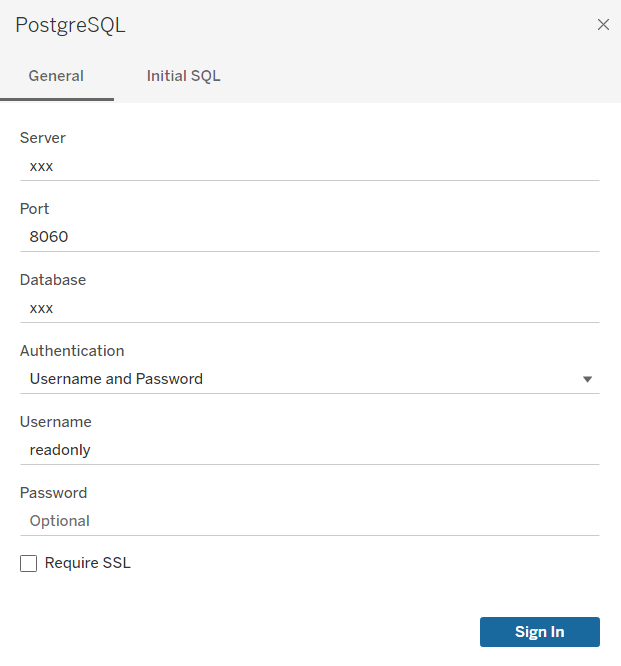
Input the configuration with your own organisation's details and credentials. After getting in you should see loads of different table names. They are the server data stored in the postgreSQL server.
I have chosen comment as my direction of analysis. Hence I looked at the documentation link and found the view (difference between database table and view in a nutshell is that a view is a reflection of the table but with some calculation logic stored inside but without the actual data, data is in the table). The view name is called "_comments". Within this view you can find data like what kind of comments are left within which specific site of the server by a specific users. But you will need a bit of joining with the site and user view in the database. I have also used "_sites" and "_user" view to get the site name and user name if you are interested to know. As most tables/ views in the server using like a "traditional relational database" where you will need some extra table to bring in the extra info you need.
As initially in the comments view the site and user has just the id (as a foreign key) and those id cannot tell you much without the actual name. So you might need a bit of joining or relationship in tableau in order to bring in those info.
My directions were initially as follow:
- Total number of comment
- Comment per site
- Who’s using comment the most
- Who’s being @ the most?
Unfortunately the last part (who's being mentioned the most) cannot be done due to time limit. But we can easily see the trend of comments, who's using it and in which site quite easily.
The reason why I cannot do an analysis on who is being tagged the most is that the tagged user are all in the comment. And some tagged people are in an unmatched user id with the user view. Or maybe it is just me cannot map with the correct field. So going forward I believe I can do a further analysis on the comment user mapping. And also a bit of text analysis on what kind of things people have been talking in the comment.
So this is the first "draft" of me (and our cohort) doing analysis on the Tableau server. For me this is quite fun to see how every colleague use server and their activities. Hope we have chance to do more of this in the future.