The week started with an stimulating challenge involving two numbers: 233 and 65. They represent the total number of Coach Kriebel’s favorite Instagram likes and Twitter favorites for the week (17-23rd of August), respectively. The task was to create as many visualizations as possible in Tableau with this tiny dataset in less than an hour. One would think there is a limited number of possible combinations in which the relationship between these two numbers can be displayed but the number simply grows to no end.
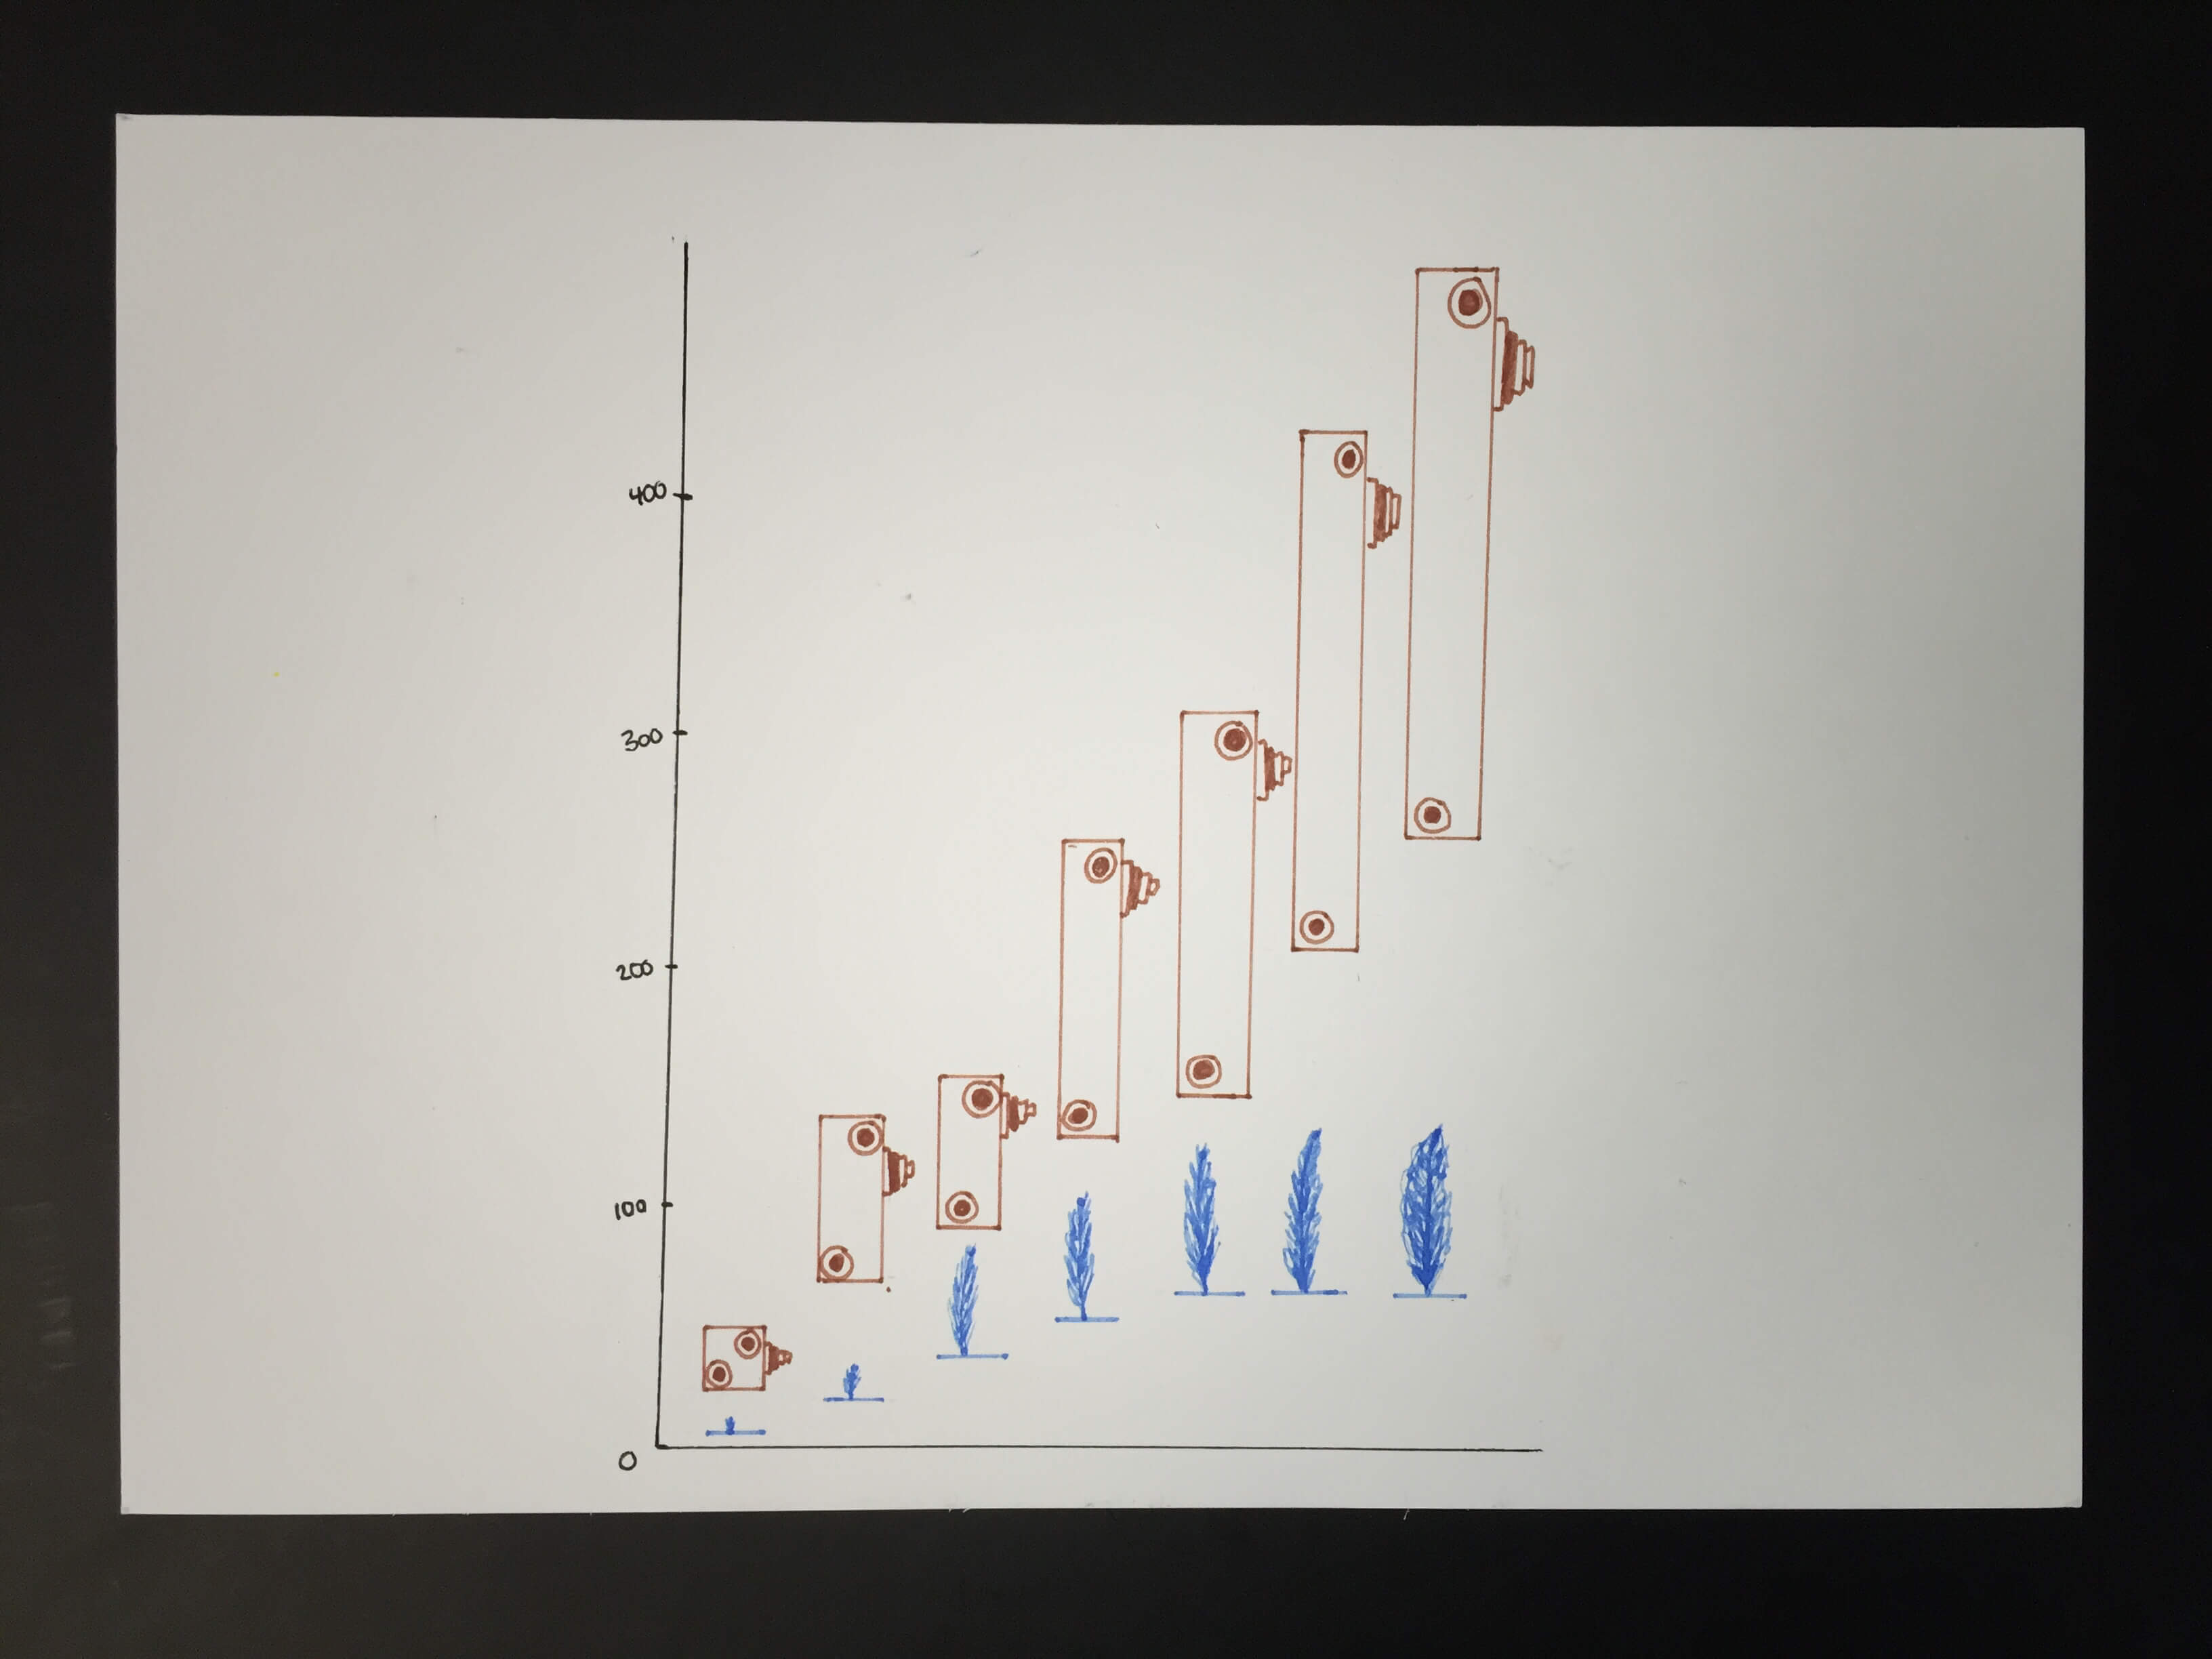
Thirteen visualizations later I wanted to create a “jittering” viz as described before, and so I decided to expand the sample of two numbers by breaking it down to its individual components (raw data) and was also able to elaborate on initial graphs (e.g. including running total calculation). You can view my dashboard here. Finally, the intention of this exercise was to warm us up to simple data and further inspire us to create a postcard for Dear Data 2. I enjoyed starting in Tableau and then translating my imagination into the world of gel pens. This resulted in a cryptic viz below!