The second week of the Data School started with a blank Alteryx canvas – the challenge being to acquire education data, cleanse and prepare it for an interactive Tableau viz.
Rapidly finding large amounts of data as shown in Figure 1, I embarked on an interesting analytic quest to define the relationship between the number of students per class and their presence/(absence) in school. These two independent data sources from data.gov.uk included multiple factors to explore such as gender, age, funding and time (years).
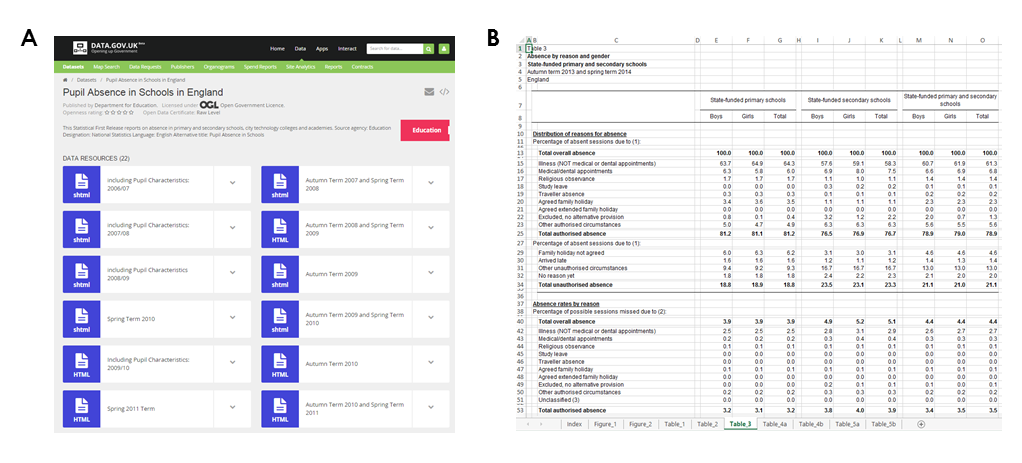
Figure 1. Investigating education data. A) UK government education open data source B) Excel spreadsheet showing percentage for school absences by reason
Alteryx is intuitive, you can drag and drop tools to create any type of workflow. I created a data cleansing workflow, labeling the different applications I used (Figure 2). Employing preparation tools such as Sample or Select to remove empty spaces, and parse and transform tools like Transpose to pivot the data. The restructuring of the “student number per class” spreadsheet resulted in a disappointingly small dataset, which could not be blended to the “absences spreadsheet” as initially planned. Therefore I continued solely to investigate the trends of “Why are kids missing school?” In future, the next natural step would be to run the same workflow on the tables for the different years, which have exactly the same layout and join all the data into a single source.
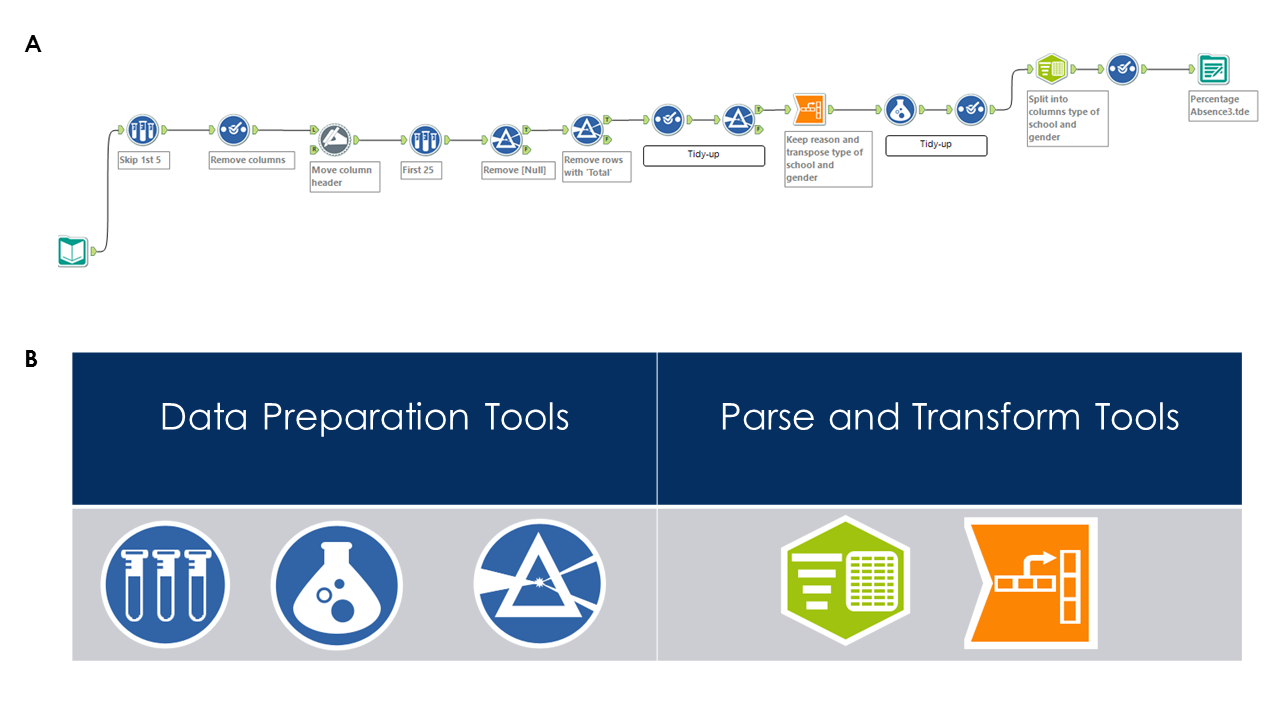
Figure 2. My first Alteryx experience. A) Cleansing workflow B) Tools used (from left to right) fall into two categories: Sample, Filter, Formula, Text to Columns, Transpose.
With 2-days of Ace training I confirm that a handful of Alteryx tools can swiftly prepare the most complex data to make a neat piece for visualization analysis in Tableau, and this could potentially save a company thousand hours!