Meeting in London with Tom and Andy to start my first week at the Data School has been one of the most amazing experiences in my life! An extremely diverse group of people has come together to understand the basic principle of our job as trainee consultants: making sense of data and communicating it. Being among the first students at The Information Lab we are the future generation that will help people improve performance. Getting to know my new colleagues (below), we are already becoming a collaborative bunch, and will work together sharing ideas to achieve bigger goals.
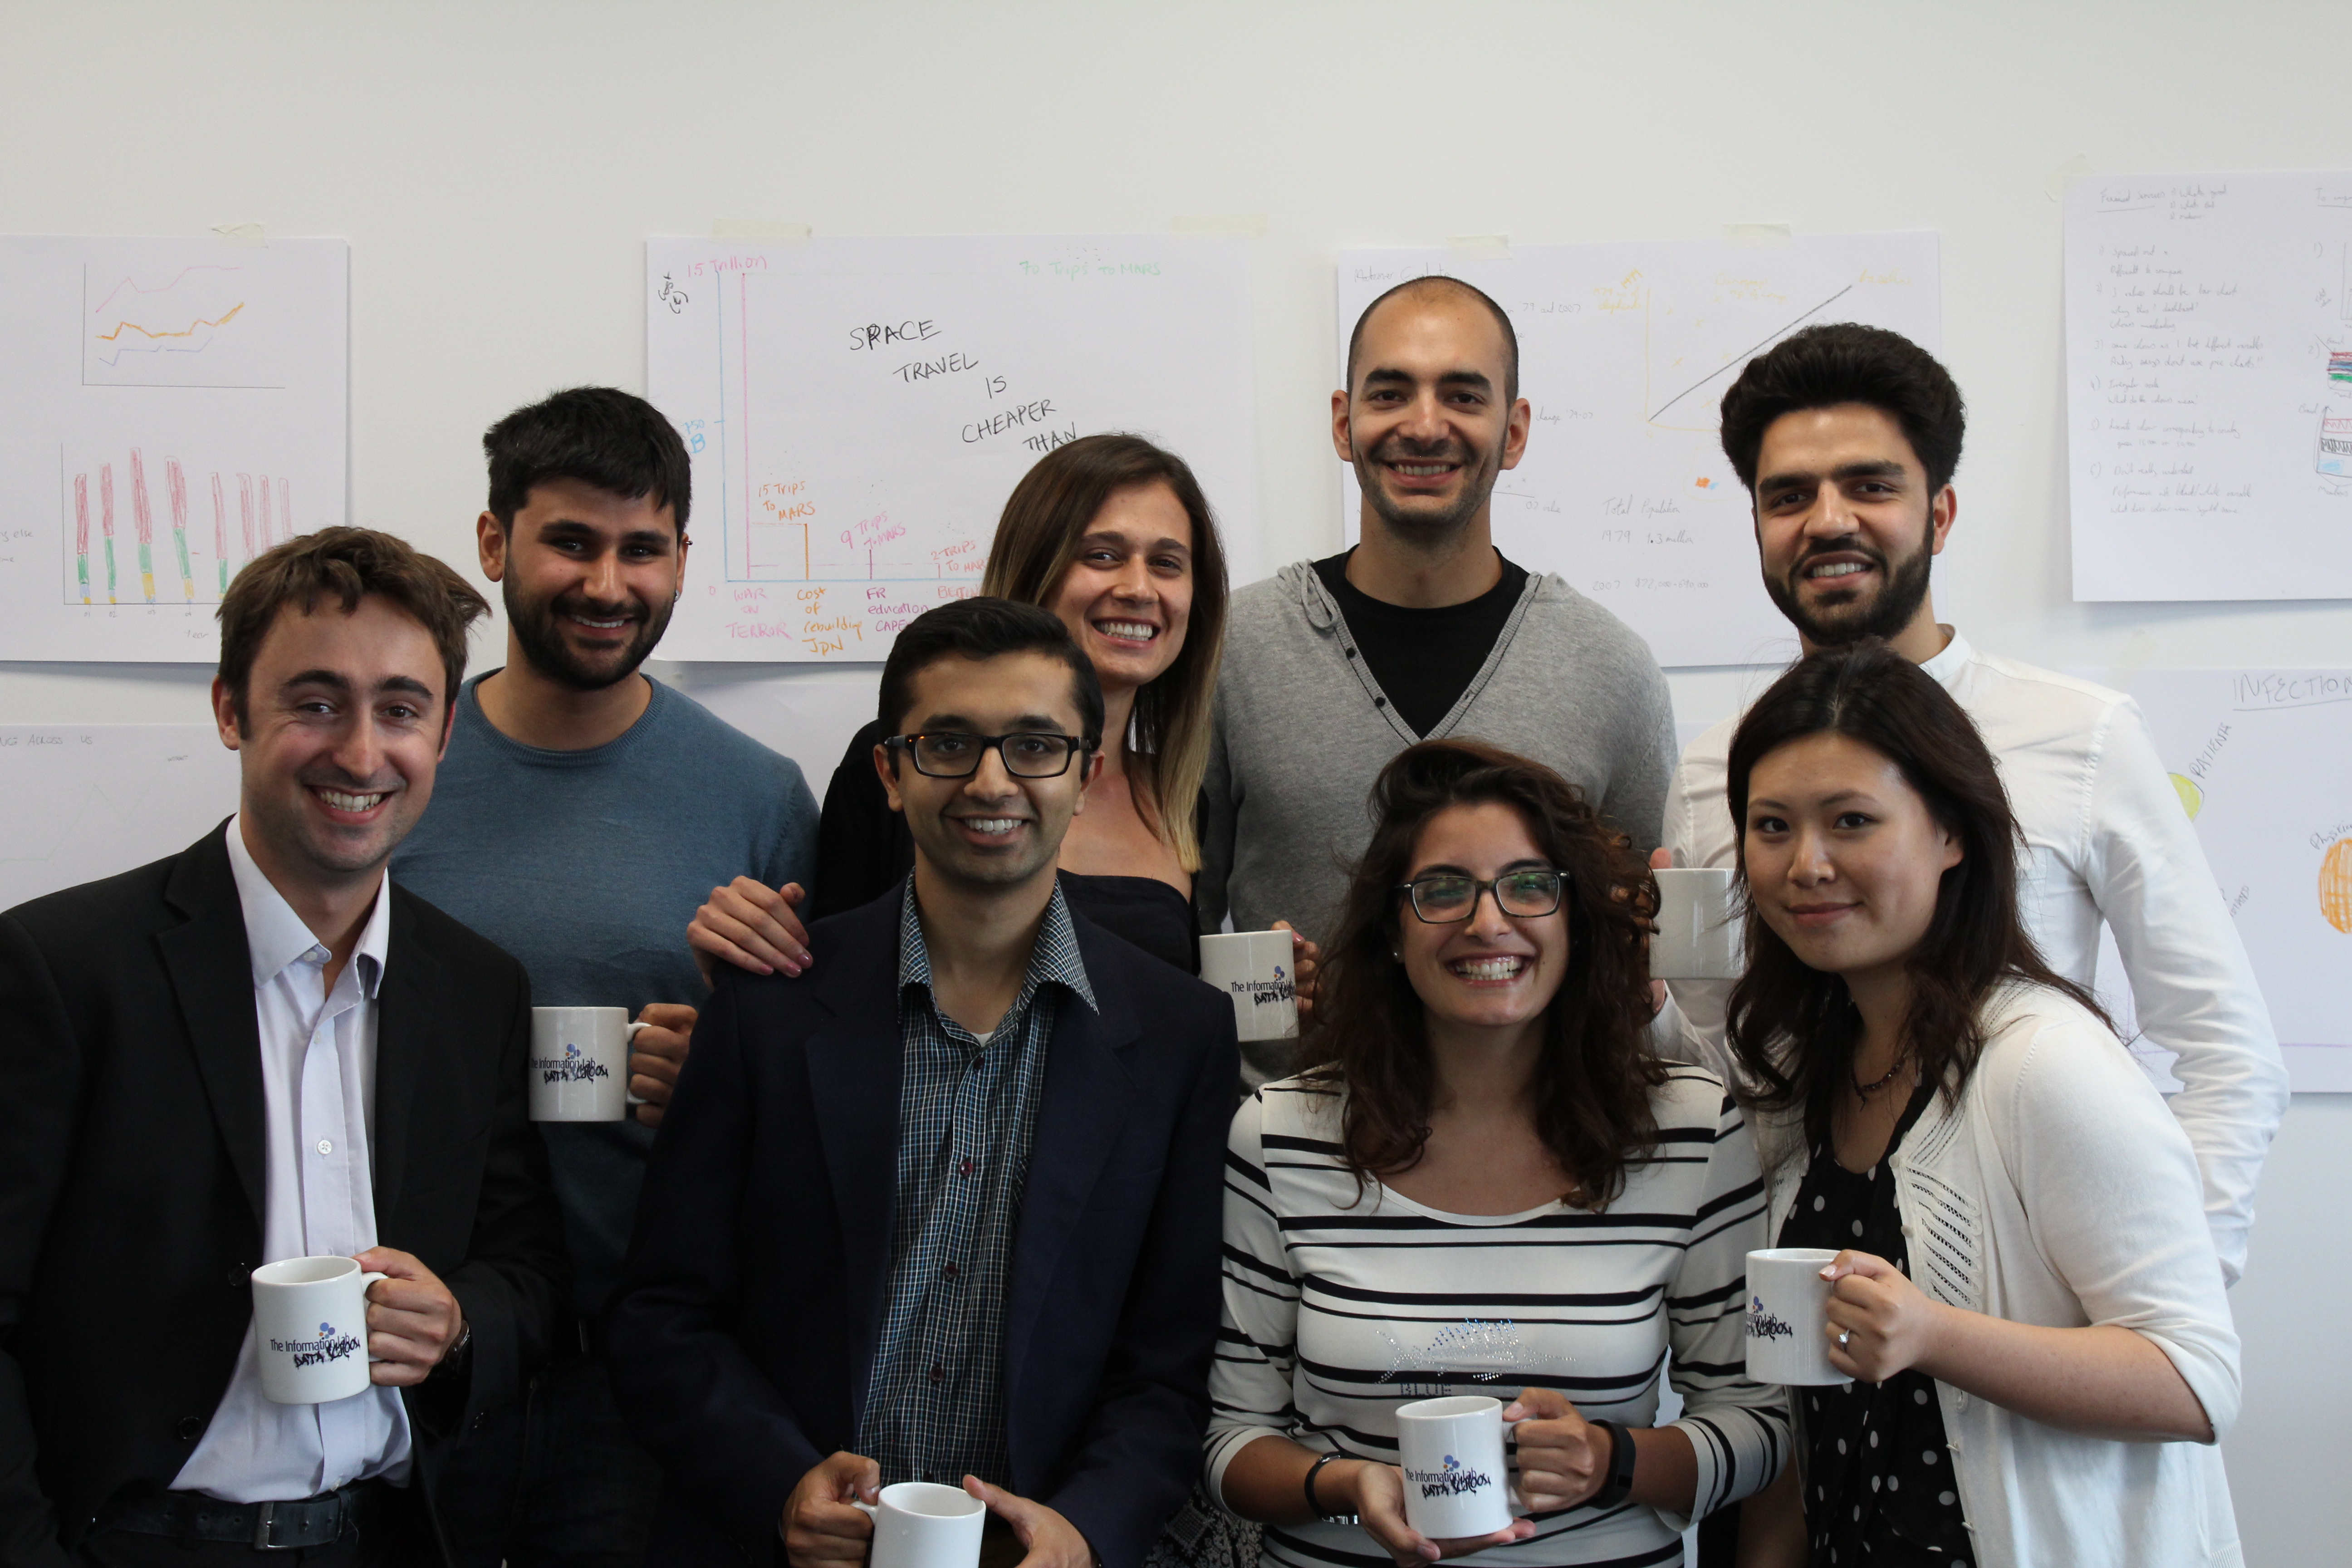 We are a happy bunch! (Top left: Nicco, me, Pablo, Hash, Alex, Ravi, Damiana and Emily)
On the first day, we started by discussing and team-working on sketches of viz “Makeovers” on paper and presenting our ideas to the whole group. On the morning of the second day we dove deep into the Zen Master training where I gained exposure to Tableau advanced chart types and order of operations. I found trying to create a complex viz within 15 minutes/6 clicks challenging but found it really satisfying to apply something I learnt (the Lollipop chart) to create my project this week.
In the afternoon Chris Love then introduced us to Alteryx revealing the infinite possibilities of 400 “drag and drop” tools which can interrogate data before attempting to visualize in Tableau. Our third priority this week after a small session on Data Viz 101 and Tableau fundamentals was to attempt the Desktop Qualified Associate Exam, which we will excel at in two weeks time at the Tableau conference in London!
At the end of a rewarding week I have learnt that the tools we are being trained on will allow us to ask more informative questions from our data, to generate new and exciting ideas and gain a better perspective.