Every Friday at DS HQ we present to our peers and to our colleagues, and broadcast our work to the wider world on The Information Lab’s YouTube channel.
We regularly present at 3pm. This week Andy gave us the gift of time. Less time. 2pm deadline giving us a 4 hour window to work with a new dataset.
Here’s how we got on.
The Data
TfL data from the Santander bike docks across the city, including journey distance, time, start and end location. You can have a look yourself on the TfL website.
Watching Tableau flex its muscles on this large dataset was great. As was the experience of digging into it and having a root around. Each member of the DS9 team found unique insights in the dataset using the Tableau tools we explored this week.
My TfL data story
As I’m often found on 2 wheels, I wanted to use these data to help explore the idea of air quality in London. London’s air quality is very, very poor. You can investigate using this great viz from KCL.
Private vehicle use is a key driver in increased air pollution across the city and the associated public health consequences of poor air quality.
So what would it take for people driving cars to get out and about on 2 wheels?

I used the available data (and supplemented it with some extra goodies from TfL) to highlight average distances for car journeys, amount of time spent in congestion for car commuters in London, and how this compares with journey times and distances for cycle hire users in London. Given the numbers, I’d be hopeful that viewers could see average journey distance is absolutely do-able by bike.
I leave the viewer with a challenge – find a bike station near you and get going! In Tableau, this is achieved using a parameter. You can read more about how to implement these in Soha’s blog post.
I’m hoping what I produced incorporates good story telling and data viz best practice.
You decide! The static image is up on twitter – I’m @AdiBop_.
It should be up on Tableau public gallery soon!
Ta for now.
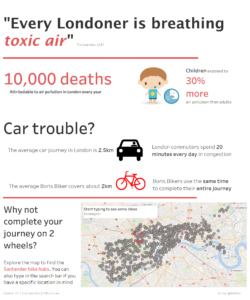
Every londoner is breathing toxic air. Why not get on two wheels?