‘Merica – heck yes!!
Today, we’re diving straight into some complex survey data.
The American Time Use Survey offers us self-reported data on how Americans spend their time. Everything from personal grooming, mowing those huge lawns, playing ping pong and socialising. The survey is a veritable treasure trove of interesting stuff. I always find it quite difficult to approach these rich datasets. It can be quite difficult to stay away from rabbit-holes and dead-ends.
I decided that my best approach was going to be to pick my story before accessing any data. My logic being that my workflows would be more efficient, my time better spent, and I would reduce the likelihood of getting sucked into a black hole of American past-times. It could have been risky if the data didn’t yield enough for me to work with. But…live by the sword die by the sword!
You”ll have read in yesterday’s post that I enjoy a little 2-wheel action, and that drove the narrative of yesterday’s dashboard. Well, I’m also firmly on Team Poor Sleep so that data jumped out at me this morning. Decision made – let’s look at the quality of America’s sleep and figure out what might be driving it.
Getting the data
It was a little more straightforward today. No pagination required. Just download one big file and open it up in Alteryx.
There was a little data re-structuring to take care of first, along with the creation of a look-up table from the official documentation that would allow me to cross-reference the codes contained in the data to its full name.
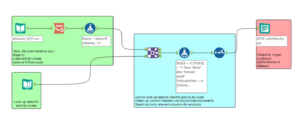
Joining those streams together and correcting some data types (also according to the official documentation) gave me my output file for Tableau. 4.5 million records processed in about 25 seconds. Outstanding work, Alteryx.
Telling the story
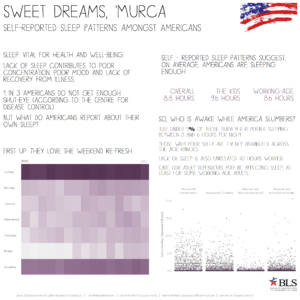
I started with some of the bigger picture stats in Tableau. Many Americans love a weekend lie-in just as much as I do.
The self-reported data starts to move away from what we see reported in health journals and by the CDC in controlled studies. Self-reported data is a bit of a law unto itself though I was surprised to see the major demographic groups cluster around central values so tightly.
I tried to identify the extremes in the data and figure out what those with less than the “recommended” sleep per day had in common, if anything.
I found there to be no connection with age, gender or number of hours worked in the week.
I did identify some of those with poor sleep also had significant caring responsibilities for an adult. The socio-economic and quality of life burden of this kind of care would warrant much, much greater investigation than I was able to give it here. Maybe I’ll have time to go back to this at a later date…
Well, here’s the final product!
As always, let me know what you think by giving me a shout on Twitter @AdiBop_.