


In the last two entries in this series on entry level spatial tools in Alteryx, we learned how to create points, how to input build buffers and trade areas around them, how to generalize polygons, and how to create grids. Today we'll go over some additional tools that will help you build polygons, analyze spatial information, and match spatial information together.
Poly-Build (and Poly-Split)
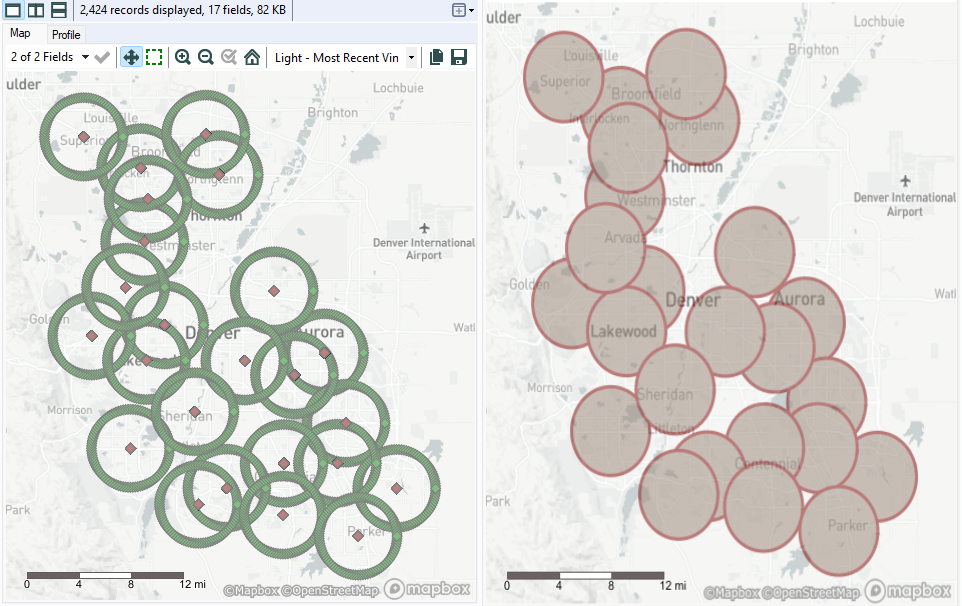
Spatial data isn't always in polygon form - sometimes it's just disconnected points. In order to build polygons, you'll need the Poly-Build tool. There are two primary configuration modes. One, the Convex Hull option, builds the most efficient convex hull around the outer perimeter of the selected points. It requires no configuration, but gives you zero control. The other mode, Sequence Polygon (or Sequence Polyline) builds a completely controlled polygon, but requires sequence numbers for each point. These numbers specify the order in which to join the points to create the polygon.
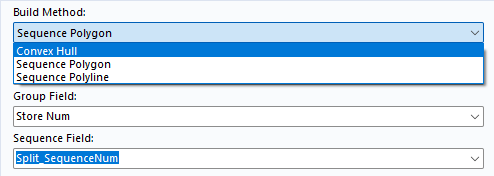
As with all spatial tools you need a Source field, and the Group field tells the tool how to group the points. On the other hand, in Poly-Split, all you need to get started is the source Spatial Field, and you'll get the points and sequence number for later recreation (if needed). That tool was used to create the set of points in the example.
Spatial Info
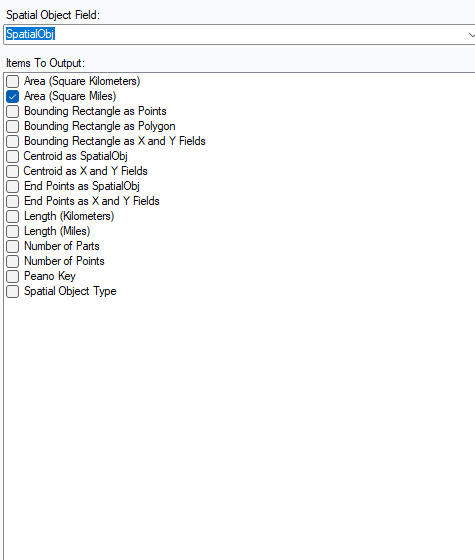
Spatial Info provides information about the spatial objects you feed into it, and with a few exceptions it will provide outputs that are not spatial objects. In my experience most of what you'll use will be the area summary, the length, number of points, and centroid (which in colloquial English we'd usually call the "center," but which properly only applies to circular shapes). In my application viz I would have loved to have access to the centroid tool when analyzing non-circular shapes; as it was, I had to use Python tools. The outputs will appear in separate columns, but otherwise for basic use the tool is self-explanatory.
Spatial Match
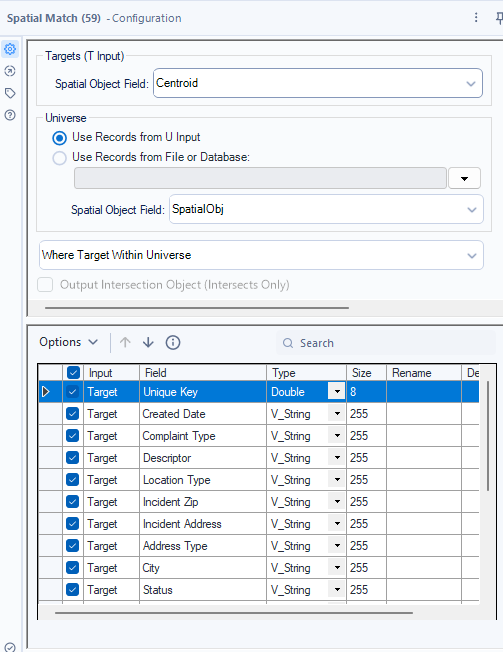
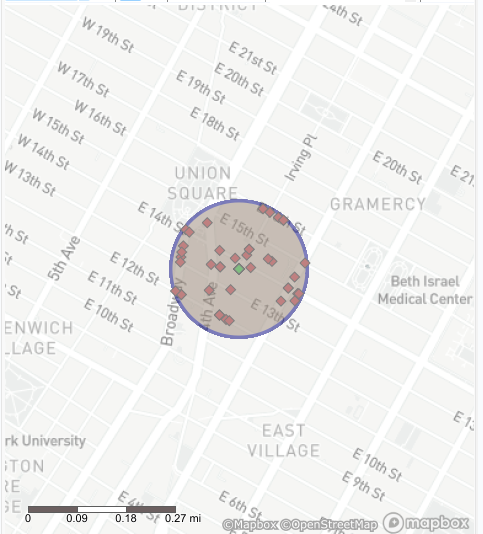
Spatial Match is the most crucial tool to learn after the foundations are established - it was used to create the feature image for this blog post, and it has the most impact on your analysis. The target is pretty self-explanatory, but the universe may require explanation - it's the set of spatial data that you're comparing the target to. You have several options for ways to compare them, including testing to see if the target is within the universe, outside it, touching it, intersecting it, and certain combinations of the above. For intersecting options, you can output only the intersection, or you can keep that checkbox unchecked and just return the targets that intersect.
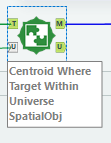
The most critical part of configuration, and the most common source of errors, is connecting the inputs and outputs. You need both a target (T) and universe (U) for inputs. Notably, the output U is different from the input U. The output U is for target members that do not match the universe (unmatched), and the output M is for target members that do match the universe (matched). Keep those straight and choose your match criterion well and you'll have success with the tool.
Bonus: Find Nearest
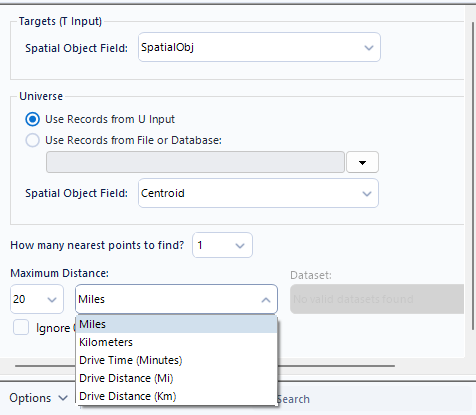
The last tool isn't necessarily essential, but it's close enough to it that I've included a brief discussion. The Find Nearest tool works similarly to Spatial Match, in that there's a target and a universe. A major difference is that it will only output a certain number of the closest points, and it's configured to accept only a maximum distance. A unique feature of Alteryx is that you can do market analysis with an optional Spatial Data license add-on. This allows you to incorporate TomTom drive time data to find points that are further away in space, but require less time. Because you'll only have access to that option if you get a reasonably rare and expensive license, that's all I'll cover, but there is some existing reading on the topic.
Conclusion
With these three blog posts we've now covered all the essential tools for Alteryx spatial data. There are more options, especially if you've purchased any license addons, but these are your most critical tools for working with the spatial data. A good next step would be to do Alteryx Challenges, using the search function to find spatial data challenges - the vast majority should be doable with just these tools. Hopefully they'll save you some time, especially if you're used to having to work with Python or other programming languages to work with this sometimes finicky data type.