Did it ever occur to you that you created a table calculation in Tableau and the result didn’t make any sense? You checked your formula, you checked how it was computing, you checked your addressing and your partitioning and it still wouldn’t work? I may have the answer 🙂 I stumbled upon it last week with a customer who tried to create a moving average and a percent of total as a secondary calculation and the results refused to add to 100%. After a lot of hair pulling I found this blog post:
https://mluttonbi.wordpress.com/2014/09/28/tableau-request-live-the-2nd-episode-data-densification/
Here the function is explained clearly and in detail, but the video is one hour long so I will go ahead and try to condense it in a blog post you can read it in 5 – 10 minutes.
First: What is data densification?
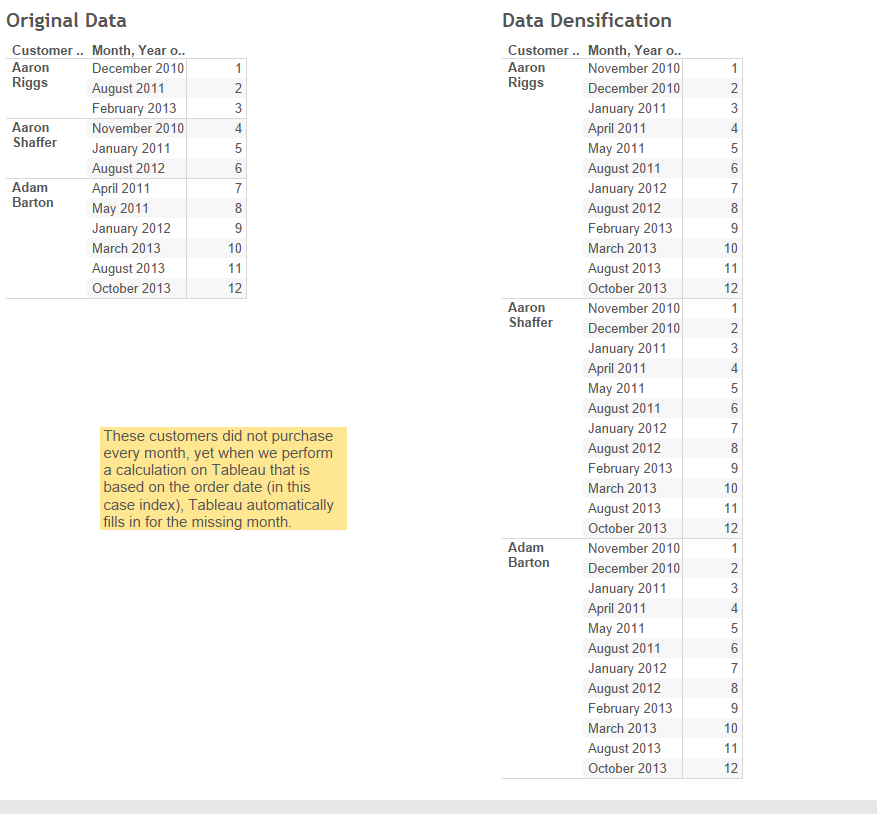
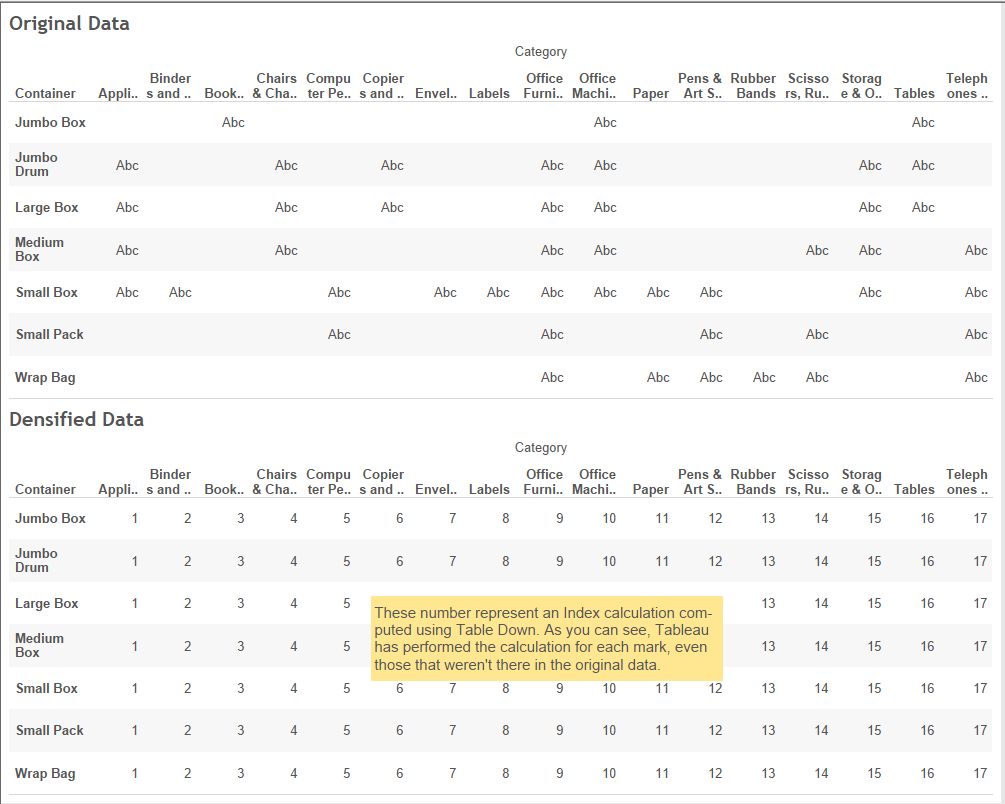
Data densification occurs when Tableau creates additional marks in the view to “compensate” for missing value; it also assigns to those marks the value it thinks it should have, based on surrounding values. Notice that these marks are not added to your data, but only on your view.
There are two types of data densification:
- Domain completion. In this case, Tableau adds one or more marks in a dimension to complete a series. For example, adding missing months in a time series. This does not happen with string dimensions, simply because Tableau doesn’t know what to fill them with, while in a date series, Tableau is aware of the natural order of months (or quarter, or days) and can proceed to fill them accordingly.

- Domain padding. Here instead, Tableau fills in the missing values in the measure you are using in your graph.
They are not mutually exclusive. Domain completion and domain padding can occur together and separately.
Second: Does Tableau always add more marks?
No, don’t worry! That does not mean all your business graphs were filled with additional marks. Data densification occurs only when table calculations are in place for which Tableau needs more marks than it has available. So, for example, for Index calculations, window calculations and so on.

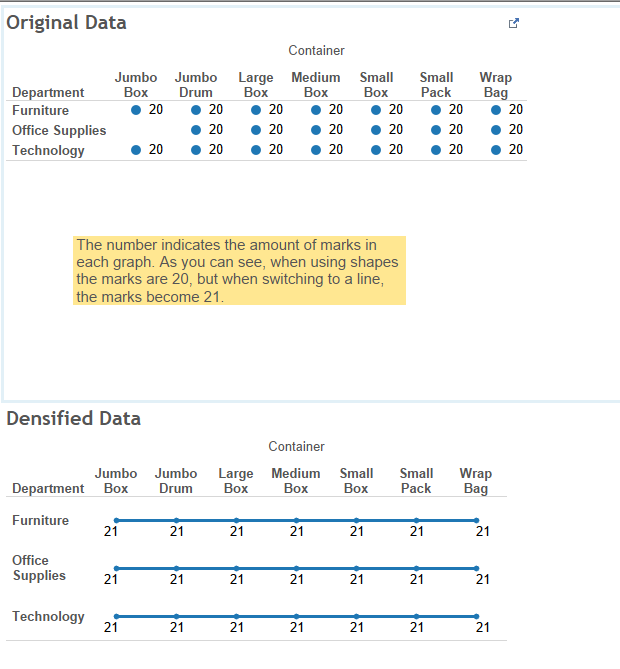
It also occurs for some type of marks only. In case of a line or of an area chart, Tableau will proceed to densify the data. But it will not do so in case, for example of shapes.
Third: How do I know if data densification is on?
There are a few ways. The first two are obvious ones: either Tableau is showing observations where you know there shouldn’t be any or your calculation look way off (i.e. your percent of total adds to 220% rather than 100%).
The third way is to look at the mark count in the bottom bar of your Tableau screen. If you are familiar with your data and that number seems too high then you know data densification is on. If you are not sure, try change mark type and see if the number of mark changes. If for example, you moved from a line to a stacked bar and your number of marks has decreased then you know Tableau is densifying your data.

Finally: How do I fix it?
There is an easy answer and a hard answer to this question. The easy answer is don’t fix it. Tableau is not changing your underlying data; rather, think of it as filling the gaps in your line or in your table. So, unless it is doing something like throwing your calculations off track, don’t bother with it. If, unfortunately, that is your problem, read on for the hard answer.
The hard answer is, there is no one quick fix, because data densification can be triggered by many causes, a window calculation, the change from discrete to continuous dimension or measure or the kind of chart you are using. Here are some things you can try out:
- Fill in missing values with zeroes. Of course this is only an option if changing your data is easy to you and if your domain densification is occurring within the measure rather than the dimension
- Change chart type. If in order to make a line continuous Tableau is adding marks in the measure or in the dimension try move to a stacked bar, that might solve your problem.
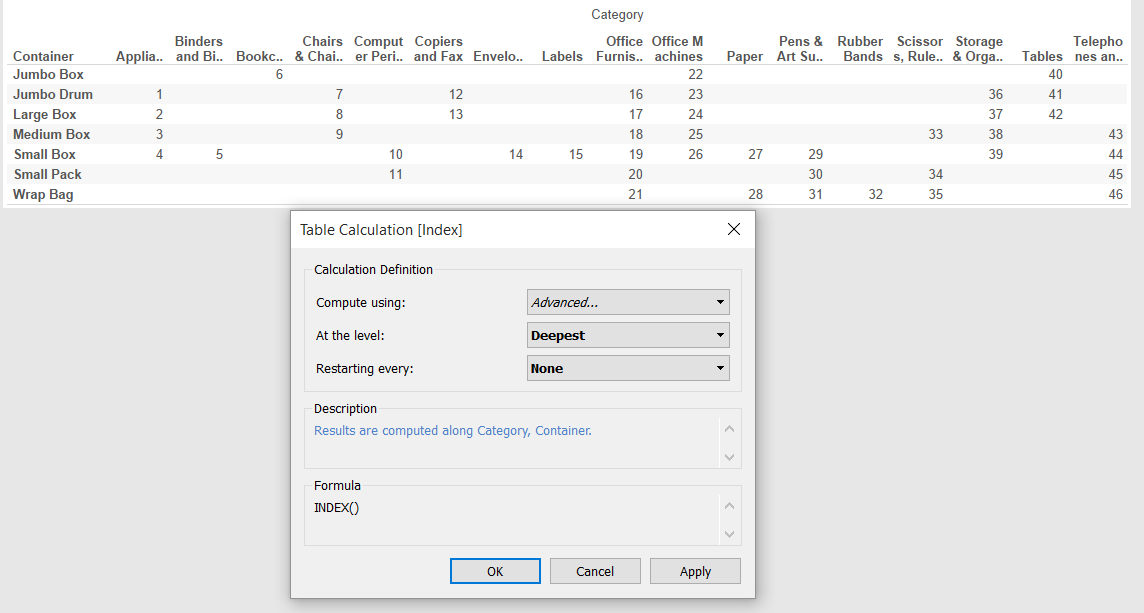
- Change your addressing/partitioning. Tableau has its default settings for table calculations, most of the time being either table across or table down. Try using the advanced function in the compute using menu and tell Tableau to address all the dimensions and compute at the deepest level (see picture below).

- Create your calculations manually. In our client’s case, what we ended up doing was letting Tableau create a window average, save that calculation as a new field and manually created a percent of total calculation of this new field with the following formula:
- [Moving Average]/WINDOW_SUM[Moving Average]
If none of this fixes the problem, try changing pills from continuous to discrete or experiment with a combination of the solutions I provided above.
Finally, if you made it to the end of this post congratulations! You are one of the few people who now understand some of Tableau’s inner working and can proudly call yourself an advanced Tableau user! But if something is not clear, don’t despair 🙂 Reach out in the comments section and I will be happy to help!
