Shortly after publishing my blog post on Groups & Hierarchies, TIL colleague Ben Moss was quick to point out that many people may be averse to using them, due to the small and fiddly nature of ‘+’ and ‘–‘ symbols that allow you to expand and collapse the dimension.
He suggested that a way to make hierarchy controls more inviting would be to link the actions to buttons on your dashboard, essentially providing website-style navigation.
This could be especially useful if you wanted to encourage drill down functionality within a published dashboard.
See the example below:

How do we make this?
The idea is that we want to set up multiple dashboards, each showing different amount of levels in the hierarchy.
Navigating among these different dashboards using ‘More Granular’ and ‘More Aggregated’ buttons will create the illusion of drilling up and down within a fixed dashboard. Sort of like a flick-book.
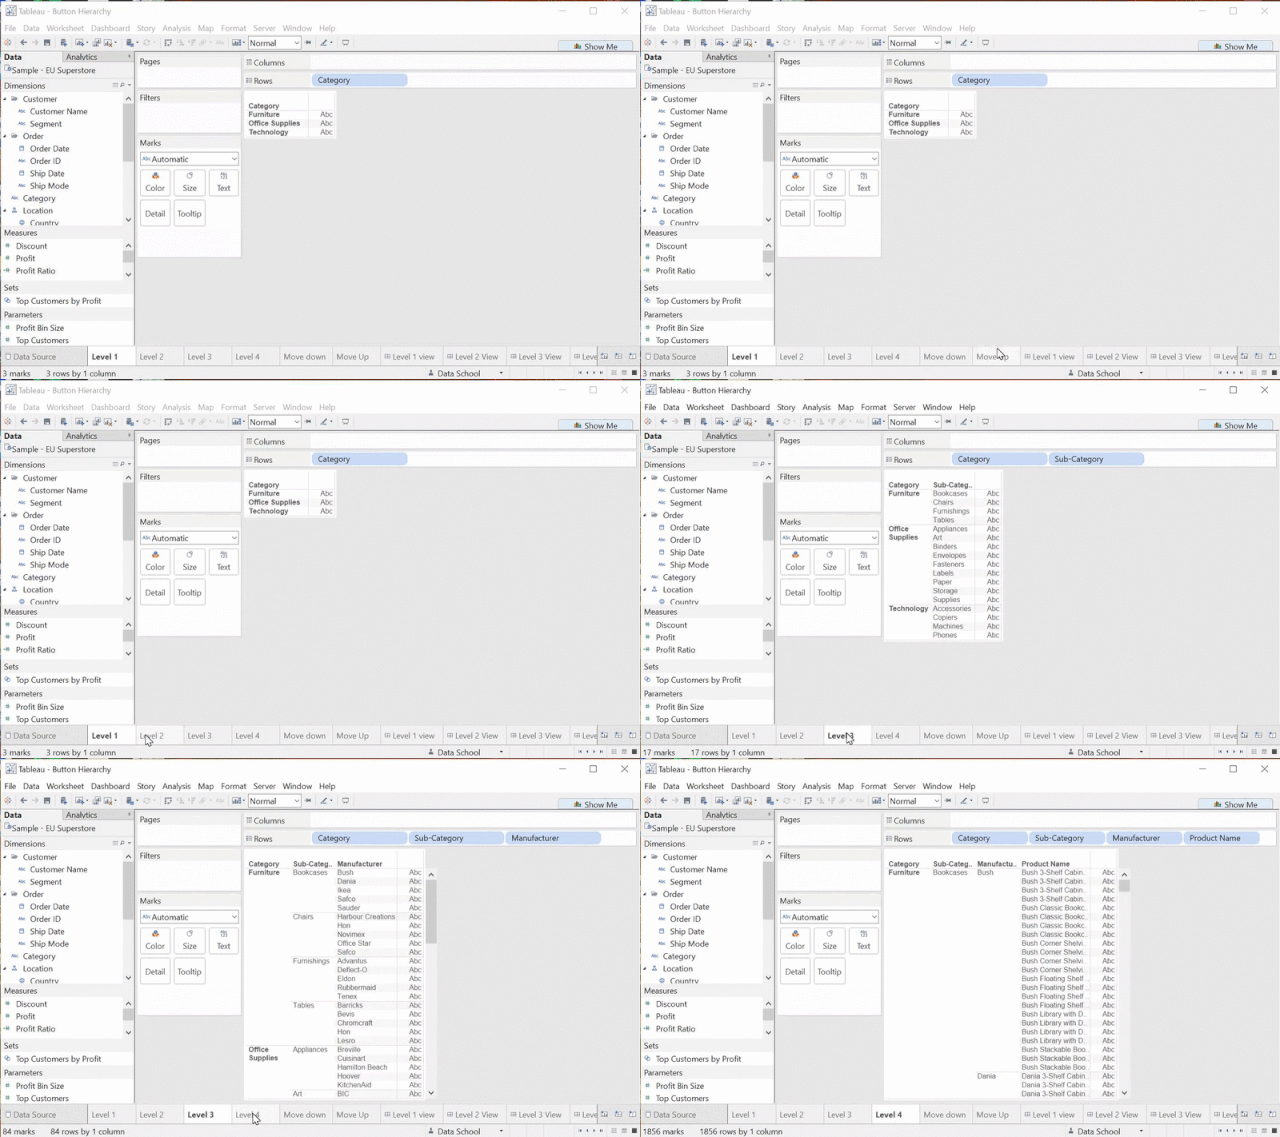
STEP 1: Set up different levels of the hierarchy in different dashboards. Using the Superstore dataset as an example, I have set up 4 different worksheets, each having one more level of granularity than the previous:
Level 1: Category
Level 2: Category>Subcategory
Level 3: Category>Subcategory>Product Name
Each new sheet should be a duplicate of the previous to ensure the table scaling remains consistent.

STEP 2: Now, to make the buttons.
Double click at the bottom of the marks card shelf. Write the text you want to appear on the button directly onto the shelf in quotation marks (so Tableau recognizes it as a string). Then drag the pill you’ve just made to the ‘Text’ card. It will appear on the view in a single cell.
Alternatively, you can select an icon to operate as your button (see Emily’s blog post).

You can then colour the button by formatting the fill of the Worksheet.

Step 3: Now to make our Level 1 view dashboard.
Open a new dashboard and drag the Level 1 worksheet onto the canvas. Then drag the ‘More Granular’ worksheet alongside it to bring the button onto the dashboard.

Lets create our Level 2 view by duplicating the first dashboard.
Now drag your Level 2 worksheet alongside the Level 1 table, before deleting it. This will ensure that your new table occupies the same container as the previous – which is essential for our ‘flick-book’ illusion.
Since Level 2 is sandwiched between adjacent levels, we need to bring both the ‘More Granular’ and ‘More Aggregated’ buttons to the dashboard, to enable navigation both up and down.
Repeat this process for all remaining Levels. On the most granular level however, only provide the ‘More Aggregated’ button, as we will only have the option to move up to higher levels.
STEP 4: Now its time to activate links between levels in the hierarchy using Dashboard Actions.
Move back to your Level 1 view dashboard. Select ‘Actions’ from the Dashboard menu, and you will see an ‘Add Filter Action’ options box (like below). Ticking the ‘More Granular’ box in the source sheet and selecting Run action on ‘Select’ will activate the ‘More Granular’ button.
Changing ‘Target Sheets’ to the Level 2 view dashboard and un-ticking all the boxes will set our next level in the hierarchy as the destination. This action basically tells Tableau to move to the Level 2 view when you click the ‘More Granular’ button on the Level 1 view.
Since the layout of these dashboards is standardised, moving between them will create the illusion of an expanding table.

On the Level 2 view dashboard, we need to follow the same protocol, but also program the ‘More aggregated’ button to allow navigation back to the more aggregated Level 1 view.
Meanwhile, on the Level 3 view dashboard (the highest level of granularity) we only need to program a navigation back to the Level 2 dashboard.
Once these action are fully programmed, the buttons will enable seamless navigation to adjacent dashboards with neighbouring levels of detail, creating the illusion of a drill-down hierarchy.
